Service utilization and health system
This page applies to the RMNCAH app only.
Two groups in the Analysis section look beyond coverage of RMNCAH interventions. Service Utilization studies how much outpatient and inpatient care children receive. Health System Performance relates services to the inputs of the health system: facilities, beds, workforce and the private sector. Both need Data Adjustment to have been run. Methods: Service utilization and Health system performance.
Service Utilization
Suggested order: check the data first, then read national and sub-national use, then the combined index.
Service Utilization DQA
Purpose. Judge whether OPD and IPD data are good enough to interpret.
Filter. A region selector (Select All for national results).
The page shows one table, Data Quality Metrics, by year. Its rows are the percent of expected monthly facility reports, the districts meeting the reporting threshold you set on Reporting Rate, the percent of non-missing OPD and IPD monthly values, the districts with no missing OPD or IPD values, OPD values that are not extreme outliers, districts with no OPD extreme outliers, the ratio of OPD to IPD for children under 5, and the percent of OPD and IPD that concerns children under 5. Download Plot and Download Data are in the toolbar.
Read this table before the utilization trends: Service utilization > Common pitfalls.
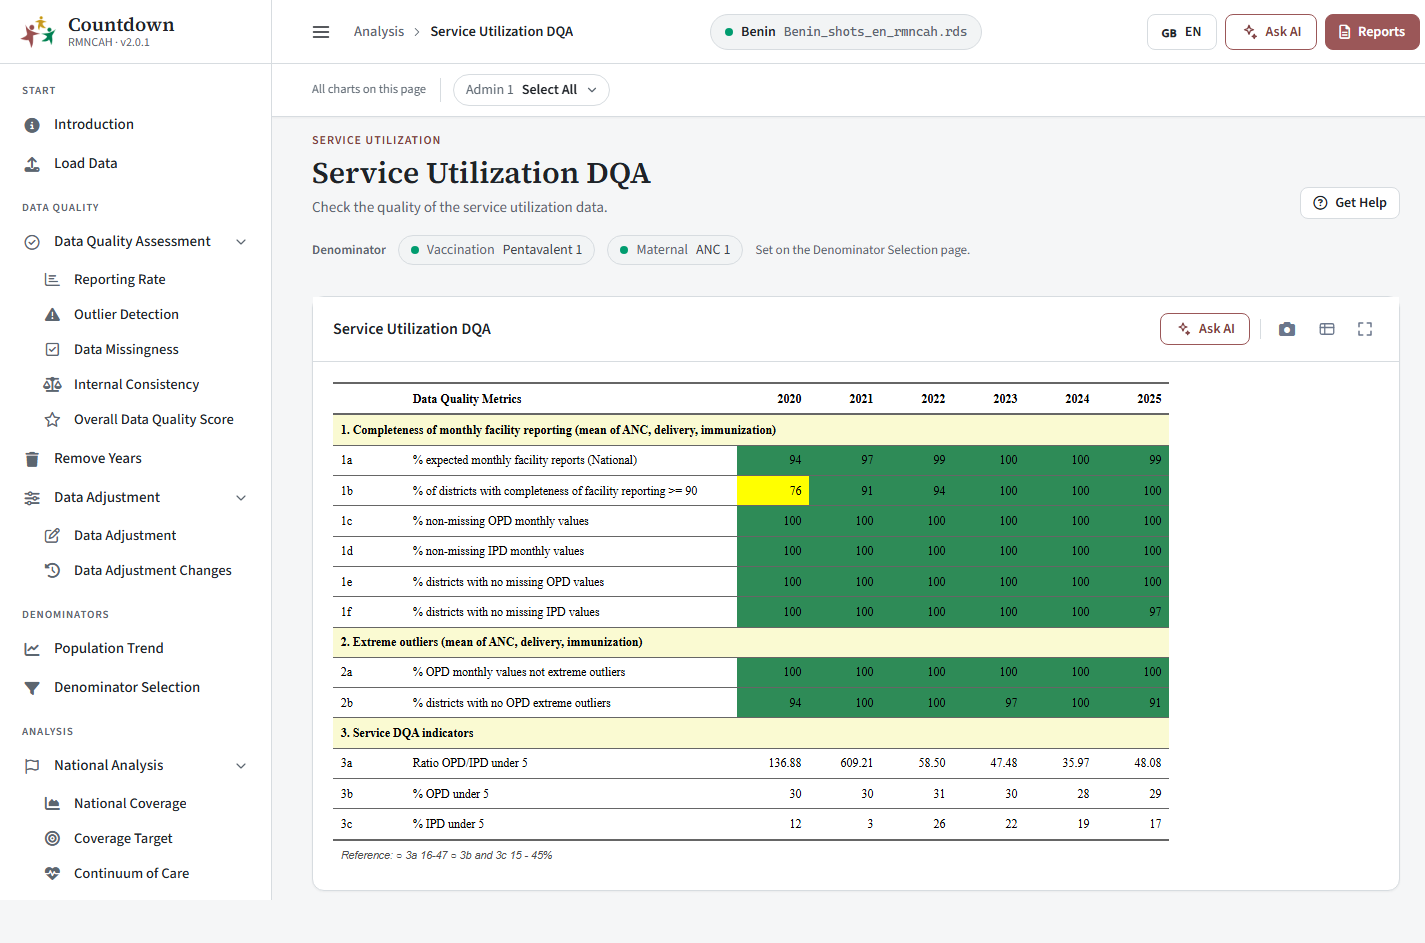 Service utilization DQA
National Utilization
Tabs: OPD Visits (visits per person per year, all ages and under 5), IPD Admissions, Under 5 (share of OPD visits and IPD admissions that are children under 5), Case Fatality Rate (under 5 and all ages) and Deaths (proportion of deaths that are under 5). A second card, with Select Years and a Palette (default Purples), maps OPD Map and IPD Map by region.
How to read it: Service utilization > Outpatient service utilization, Case fatality rate and Interpretation.
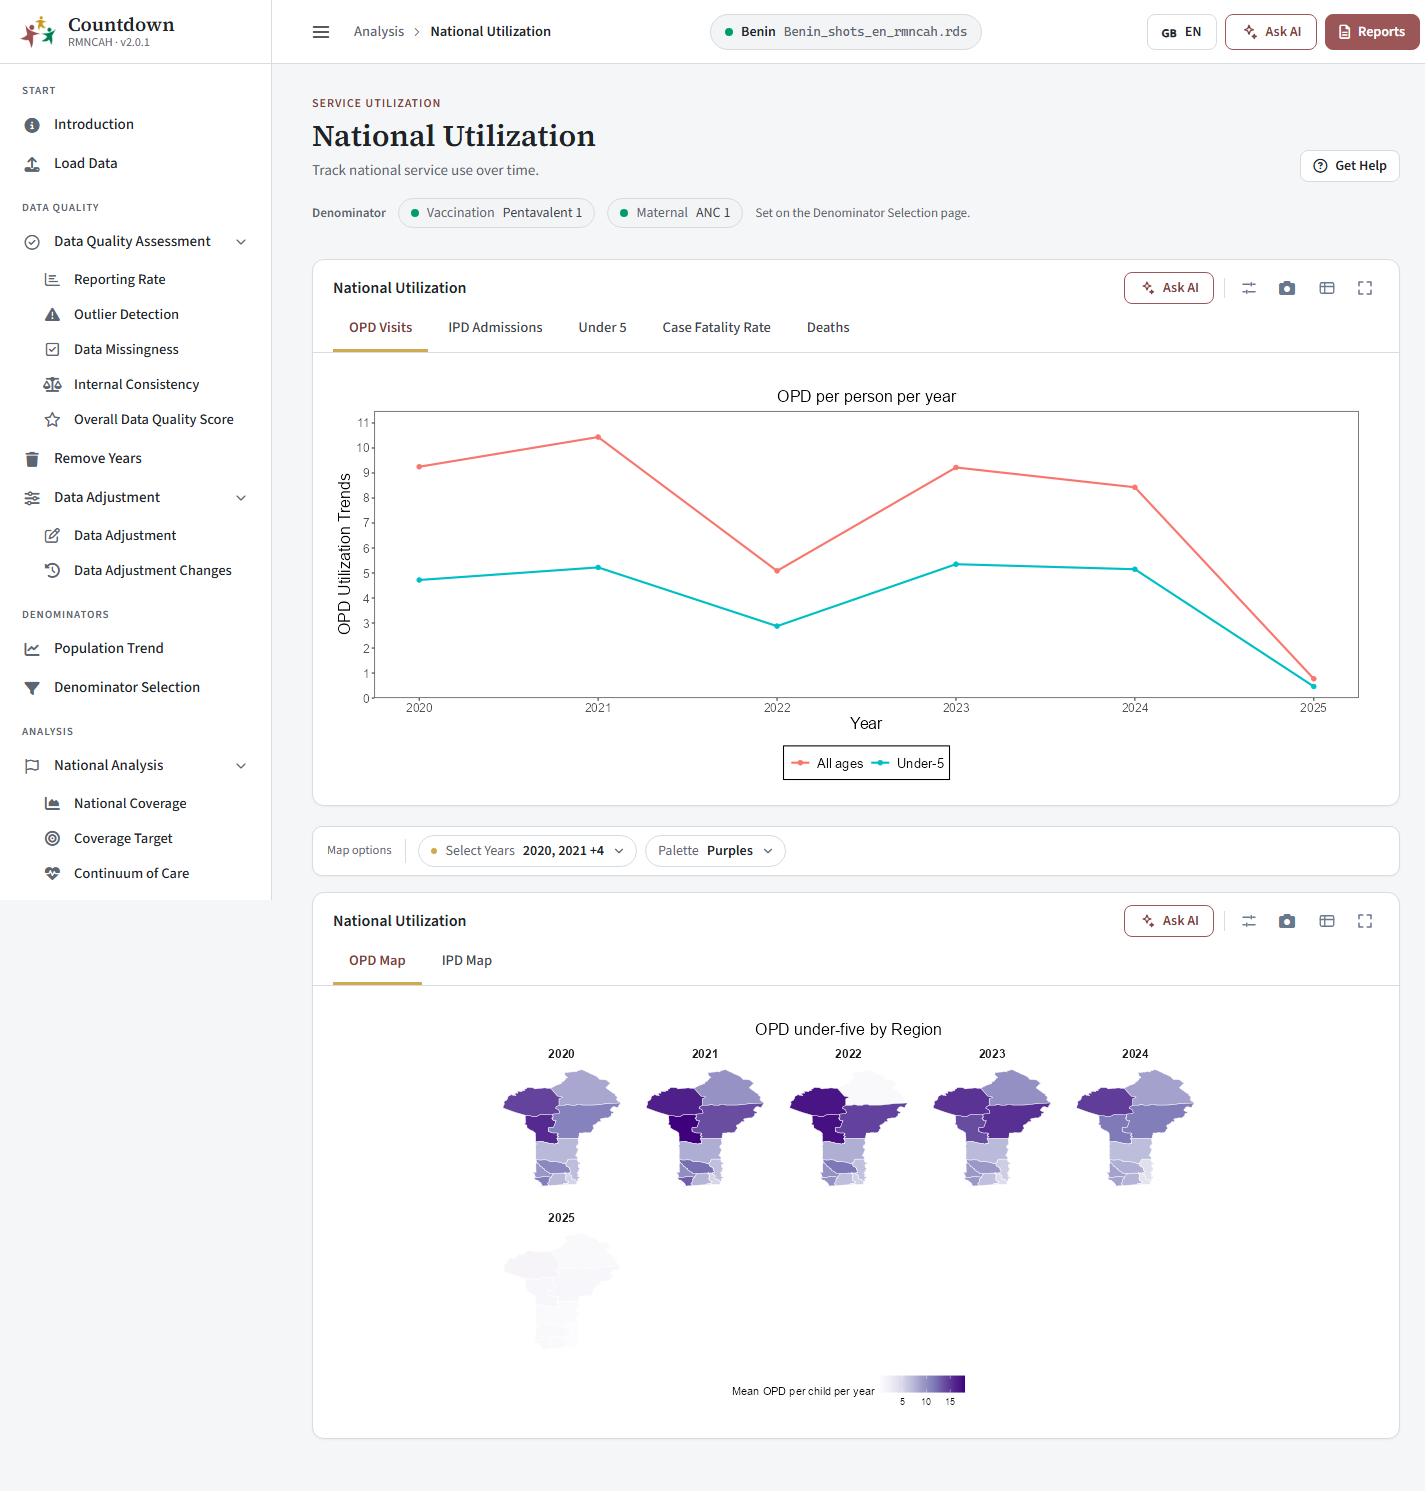 OPD visits
Sub-National Utilization
Choose a region (or Select All) to see the same tabs for that area, plus a second card, Sub-National Utilization, with the tabs OPD Visits and IPD Admissions showing the distribution across Admin 1 regions: OPD per child under 5 per year and IPD admissions per 100 children under 5.
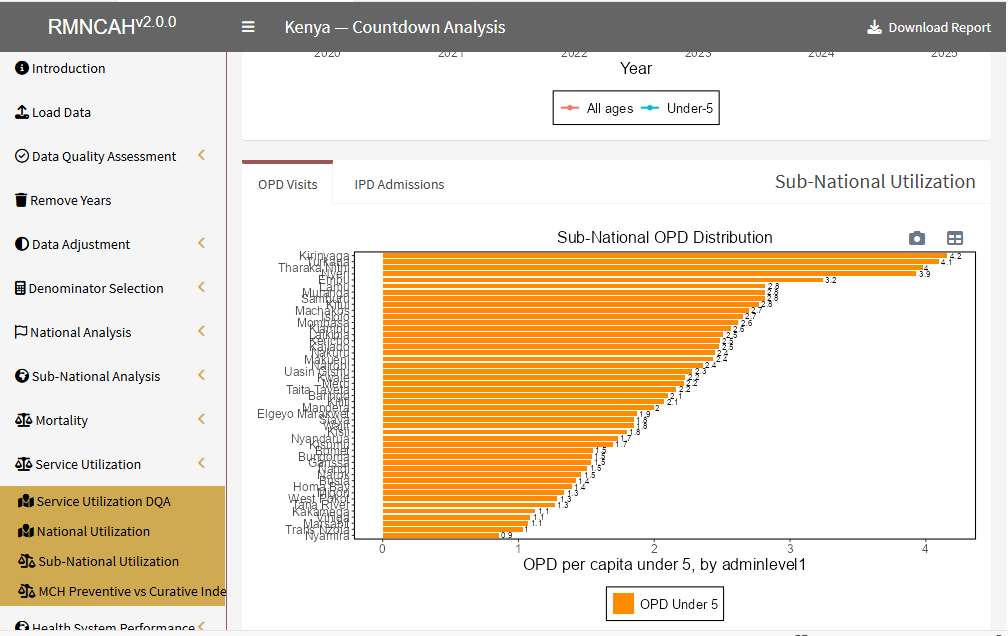 Sub-national distribution of OPD
MCH Preventive vs Curative Index
Each dot is an Admin 1 region. The horizontal axis is the MCH Preventive services index and the vertical axis the Curative service use index. Median lines divide the plot into four quadrants: low or high preventive, and low or high curative. Generate Report opens the service utilization report.
What the indices measure: Service utilization > MCH preventive vs curative index. How to read the quadrants: Reading the MCH preventive vs curative index.
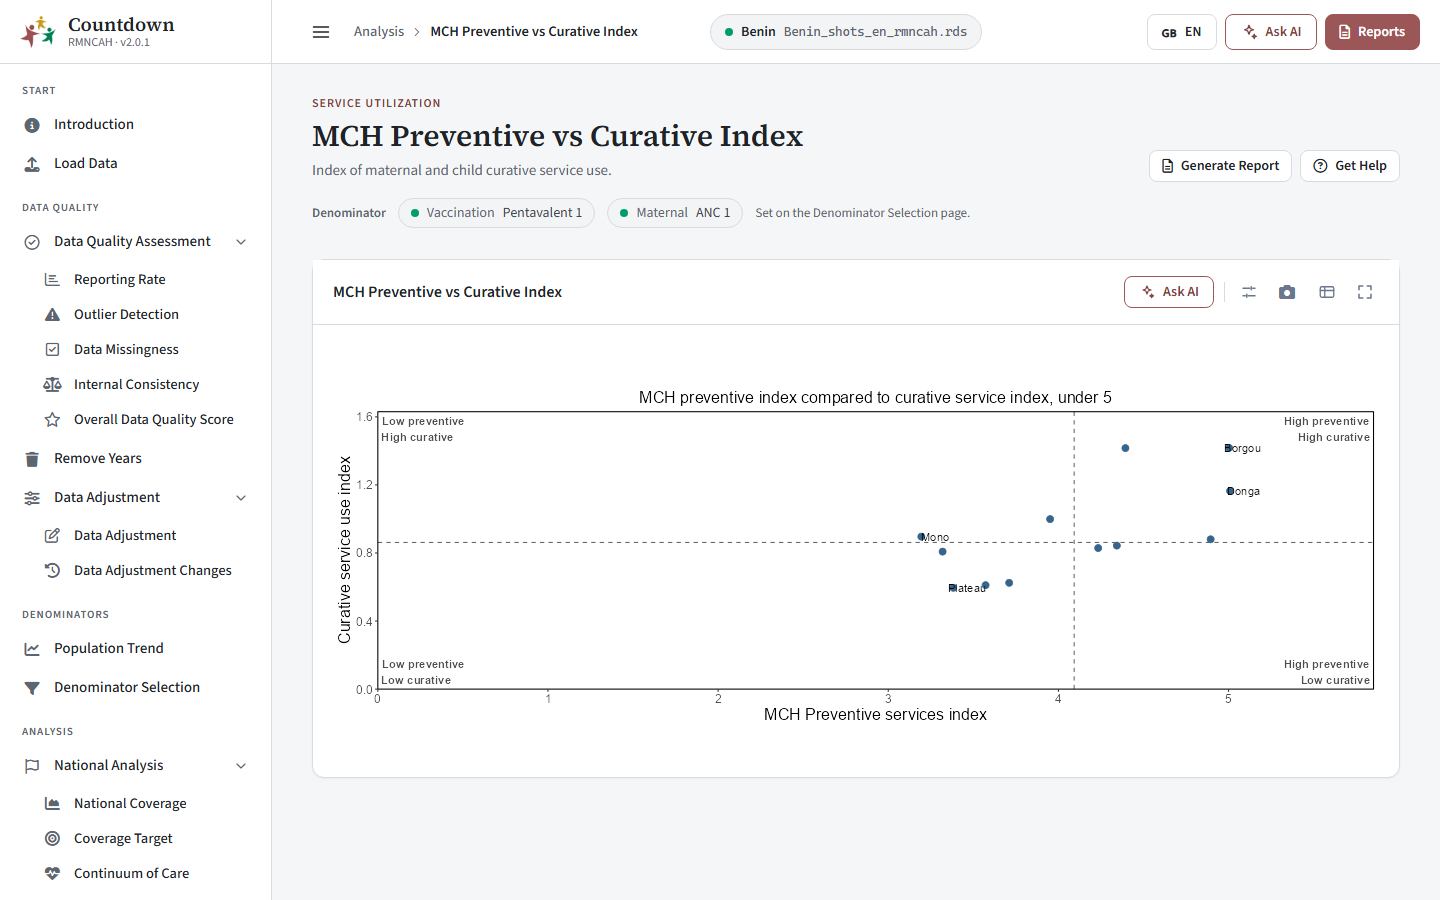 MCH preventive versus curative index
Health System Performance
National Health System
A table of health system indicators for the latest year, with the columns Indicator, Value and Unit, in three sections: Health infrastructure (facility density per 10,000, share of facilities that are hospitals, hospital density per 100,000, inpatient bed density per 10,000), Health workforce (workforce density per 10,000 and the ratio of nurse-midwives per physician) and Role of private sector (share of private and of NGO facilities). Download the table or its image from the toolbar. Indicator definitions: Health system performance > Input indicators and analytical benchmarks.
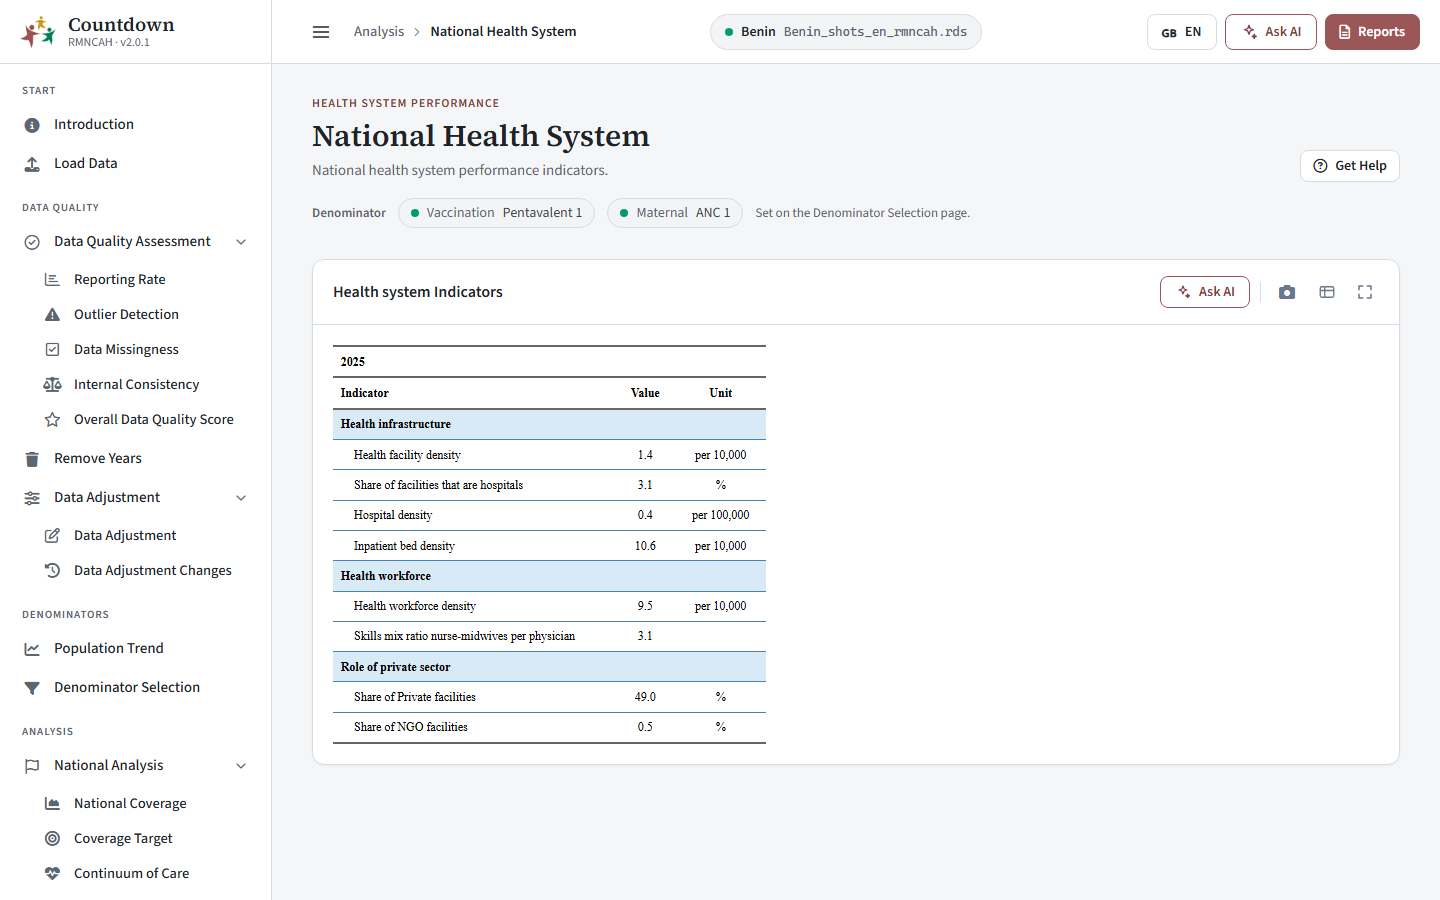 National health system
Sub-National Health System
Tabs: Health Facility Density, Hospital Density, Workforce Density and Bed Density. Bars show each region against the National average line. For facilities, beds and workforce a dashed Target benchmark is drawn and bars are coloured Meets benchmark or Below benchmark; hospital density has no benchmark line.
The benchmark values: Health system performance > Benchmarks drawn in the apps.
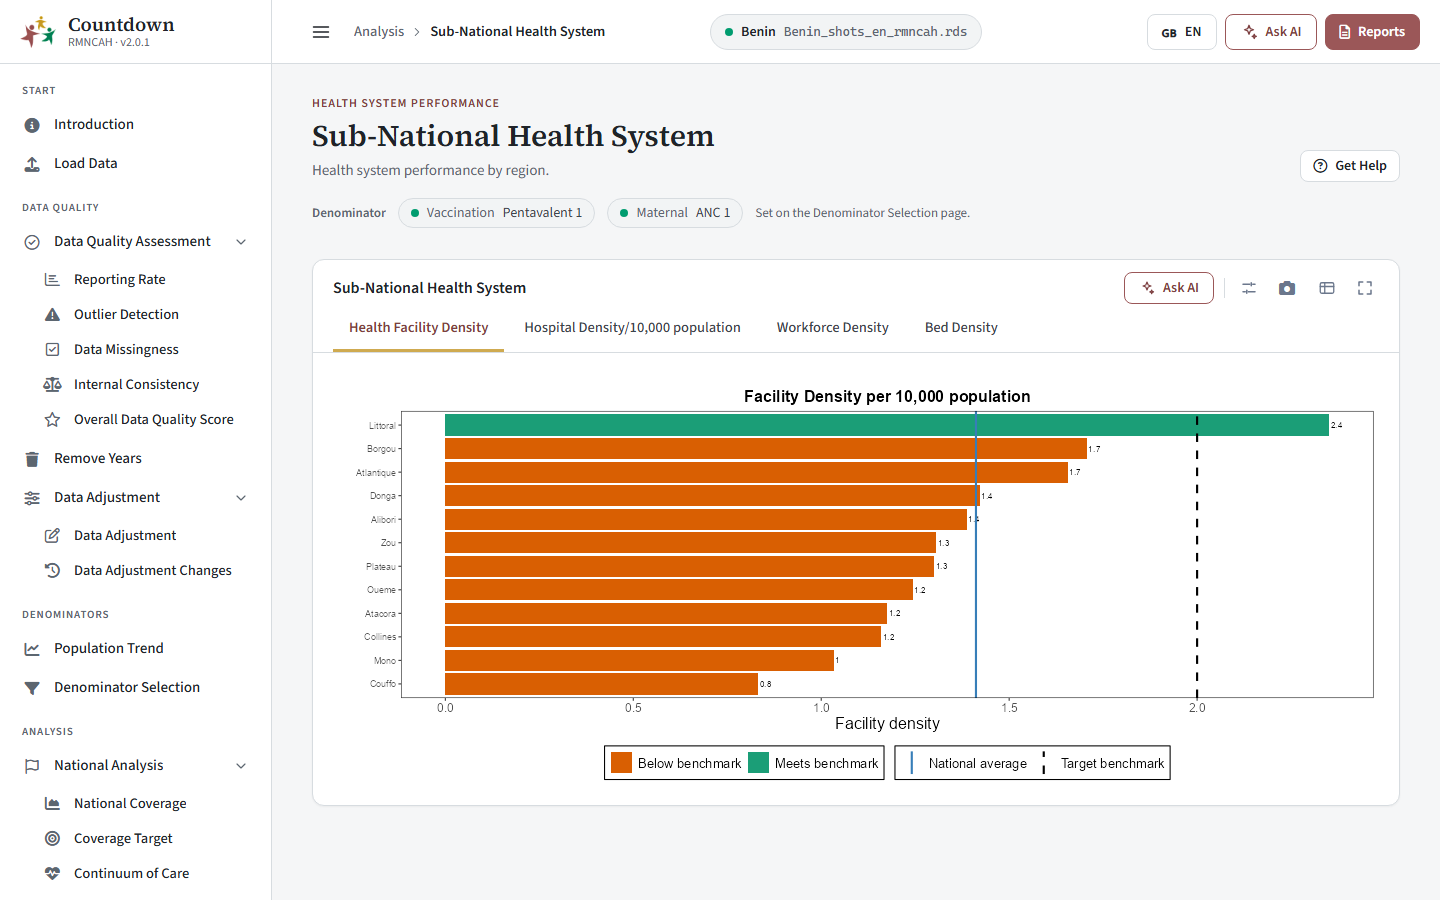 Health facility density by region
PHC Performance
Tabs: Health Facility Density and Workforce Density. Each scatter plot relates an input to a service index for the Admin 1 regions. Dashed median lines split the chart into quadrants, for example high density with a low service index. Unusual regions are labelled.
How to read it: Health system performance > Interpretation and Common pitfalls.
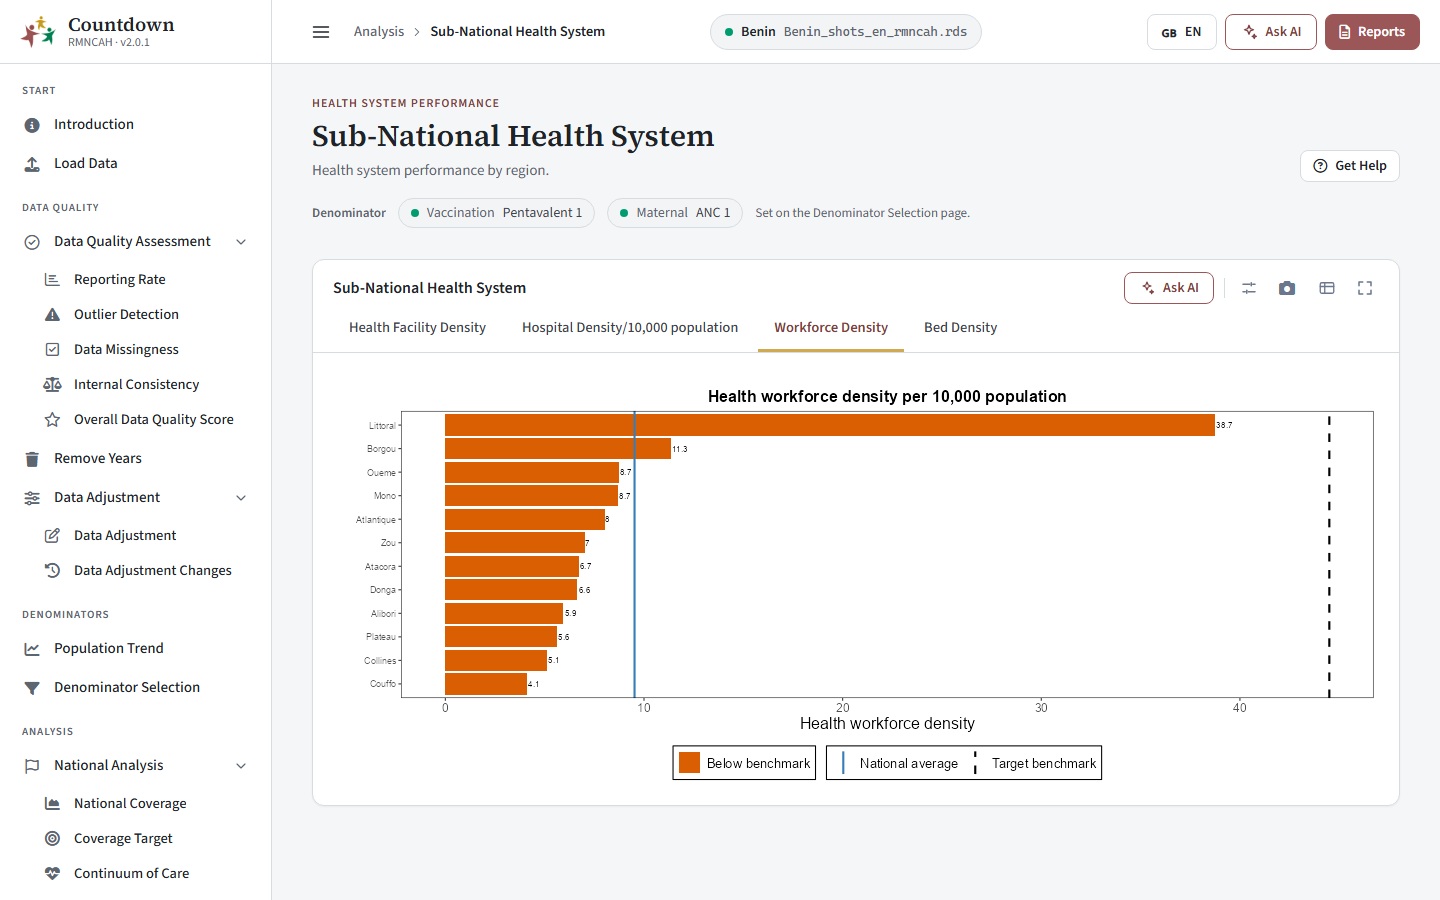 Health system by region
Public/Private Share
The top card shows the ownership of health facilities as percentages of Private, NGO and Public. Below it, tabs National and Urban/Rural show the public and private split nationally and by area of residence.
The chart title currently reads Ownership of health facilities, 2024 (DHIS2). Check that the year matches your data before quoting it.
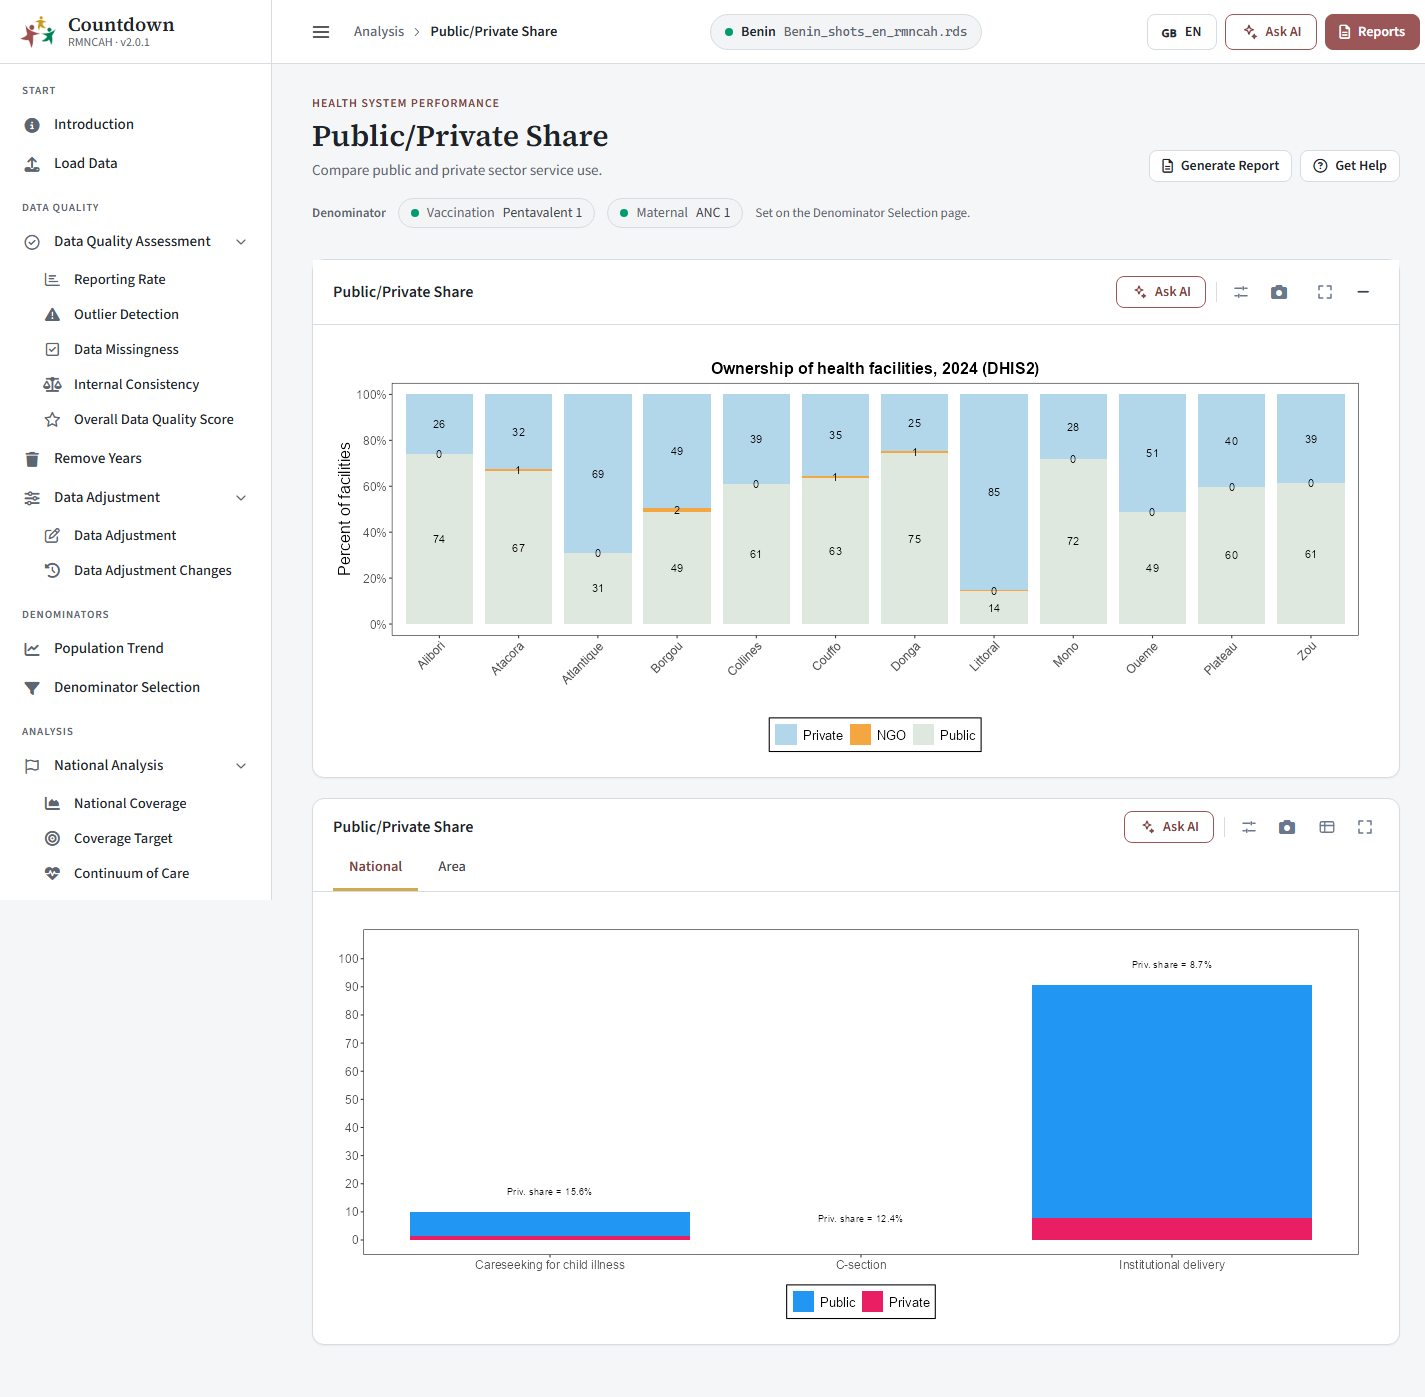 Public and private share
Common pitfalls
Pitfalls in interpreting these results: Service utilization > Common pitfalls and Health system performance > Common pitfalls.