Curative health services utilization for sick children
Routine health facility data on outpatient visits and hospital admissions show how far children under 5 reach curative services, and facility case fatality serves as a proxy for the quality of clinical care. This step produces these indicators at national and sub-national level.
At a glance
- Answers: How much outpatient and inpatient care do children under 5 receive, and what does facility case fatality suggest about the quality of clinical care?
- Uses: OPD visits (new visits and re-visits) and hospital admissions (new admissions and re-admissions), for children under 5 and individuals 5 years and older, adjusted for incomplete reporting and extreme outliers in data adjustment (case fatality uses unadjusted data); the DHIS2 projected under-5 population.
- Produces: OPD visits per child per year, the under-5 share of OPD visits, admissions per 100 children under 5 per year, the under-5 share of admissions and the pediatric case fatality rate, nationally and by region; the utilization rates are compared with health system inputs in health system performance.
- In the apps: Service utilization and health system (RMNCAH app only).
Why it matters
Scientific basis for the analysis
There is limited routine information regarding curative service utilization, even though diarrhea and pneumonia remain leading causes of child mortality. Service utilization statistics on care-seeking behavior among children with recent illnesses (diarrhea, acute respiratory infection, or fever in the preceding 2 weeks) are traditionally obtained from household surveys, which rely on maternal recall.
Routine health facility data on outpatient department (OPD) visits serves as a direct indicator of access to curative services: fewer than one visit per person per year is generally considered an indicator of poor geographic or financial access. Similarly, data on hospital admissions reflects service access, while institutional facility-based mortality (case fatality) serves as a proxy indicator for the quality of clinical care.
Method
Description of analytical steps
The data on OPD visits must include both new visits and re-visits. These data are usually stratified into two main cohorts: children under 5 years of age, and individuals 5 years and older.
As with maternal care, newborn care, and immunization metrics, data quality is systematically assessed first. Adjustments are applied to correct for incomplete reporting, and extreme outliers are resolved. This adjusted, clean dataset is then utilized for trends and comparative analyses at both national and sub-national tiers.
Outpatient service utilization
Outpatient department data inputs must include both new visits and re-visits combined.
Mean number of OPD visits per child per year
To track the frequency of care-seeking coverage, the metric is structured as follows:
- Numerator: Adjusted number of under-5 OPD visits within a calendar year.
- Denominator: Total projected population of children under 5 years of age extracted from the DHIS2 projections.
Mathematically, this rate is expected to remain highly stable over time, with an expected variance of less than 0.2 visits per child per year between consecutive reporting periods. A gradual, steady increase over time points to either genuine improvements in physical access to OPD services or an escalating disease burden within the pediatric population.
While there is no rigid global cut-off threshold, an attendance rate of fewer than 1 visit per year per child indicates that access barriers are likely restricting service utilization. OPD statistics are routinely calculated and tracked at the national and regional/provincial levels.
Percent of OPD visits contributed by children under five years
This metric serves as an internal check for data consistency. The proportion of under-5 visits typically accounts for 15% to 45% of all recorded outpatient consultations.
- In high-fertility settings (e.g., countries with a Total Fertility Rate > 4), this proportion is expected to sit on the higher end of the spectrum, frequently exceeding 30%.
- Data quality flags: If the calculated percentage falls completely outside the 15%–45% boundary, a data quality issue may be present. Furthermore, a sudden shift between years exceeding 5 percentage points flags potential reporting inconsistency.
Inpatient service utilization
The data on hospital admissions include both new admissions and re-admissions. These records are stratified by age into under-5 and 5 years and over cohorts. Where available, patient discharge data (calculated as: ) is the preferred analytical input.
A review of reporting completeness and the presence of extreme outliers is used to evaluate inpatient data quality. Because reporting rates from hospitals and facilities with inpatient departments (IPD) can be more complex to track than routine outpatient data, the decision to adjust for incomplete reporting relies heavily on the technical judgment of the country team regarding registry reliability.
Extreme monthly outliers are common in inpatient data due to compilation errors; corrective adjustments must be applied cautiously. It is highly recommended to assess and compare both the unadjusted and adjusted data outputs side-by-side.
Number of admissions per 100 children under 5 per year
This serves as a core indicator of inpatient access capacity. A calculated value of fewer than 2 admissions per 100 children under-5 per year indicates very low access to acute inpatient services. For context, the median baseline across sub-Saharan African countries for the 2018–2022 period was 4.5 admissions per year.
Annual fluctuations are expected to be minimal; a year-to-year shift of 1 or more admissions per 100 children is highly unlikely under normal circumstances unless tied to a documented emergency, such as an epidemic or outbreak.
Percent of admissions contributed by children under five years
This is used as a data quality validation indicator. The percentage typically ranges between 10% and 40% of all recorded facility admissions.
If the value falls outside this specific reference interval, it points to either an underlying data quality issue or an exceptional epidemiological event. A year-to-year fluctuation exceeding 5 percentage points flags an active data quality problem.
Case fatality rate
The case fatality rate serves as a key proxy indicator for the quality of clinical care within facility wards. It is mathematically defined as:
Methodological rule: Case fatality calculations must be performed using unadjusted data inputs exclusively. The platform does not apply reporting completeness adjustments or outlier corrections to either the raw number of institutional deaths or total admissions in this module.
A lower case fatality rate within health facilities corresponds directly to a higher standard of acute clinical care.
MCH preventive vs curative index
The index places each Admin 1 region by its use of preventive and of curative services for children under 5:
- MCH Preventive services index: antenatal, delivery, postnatal and immunization services per child under 5, weighted by importance.
- Curative service use index: OPD visits and IPD admissions per child under 5, with admissions counted ten times a visit.
Median lines divide the regions into four quadrants: low or high preventive, and low or high curative.
Interpretation
Outpatient visits
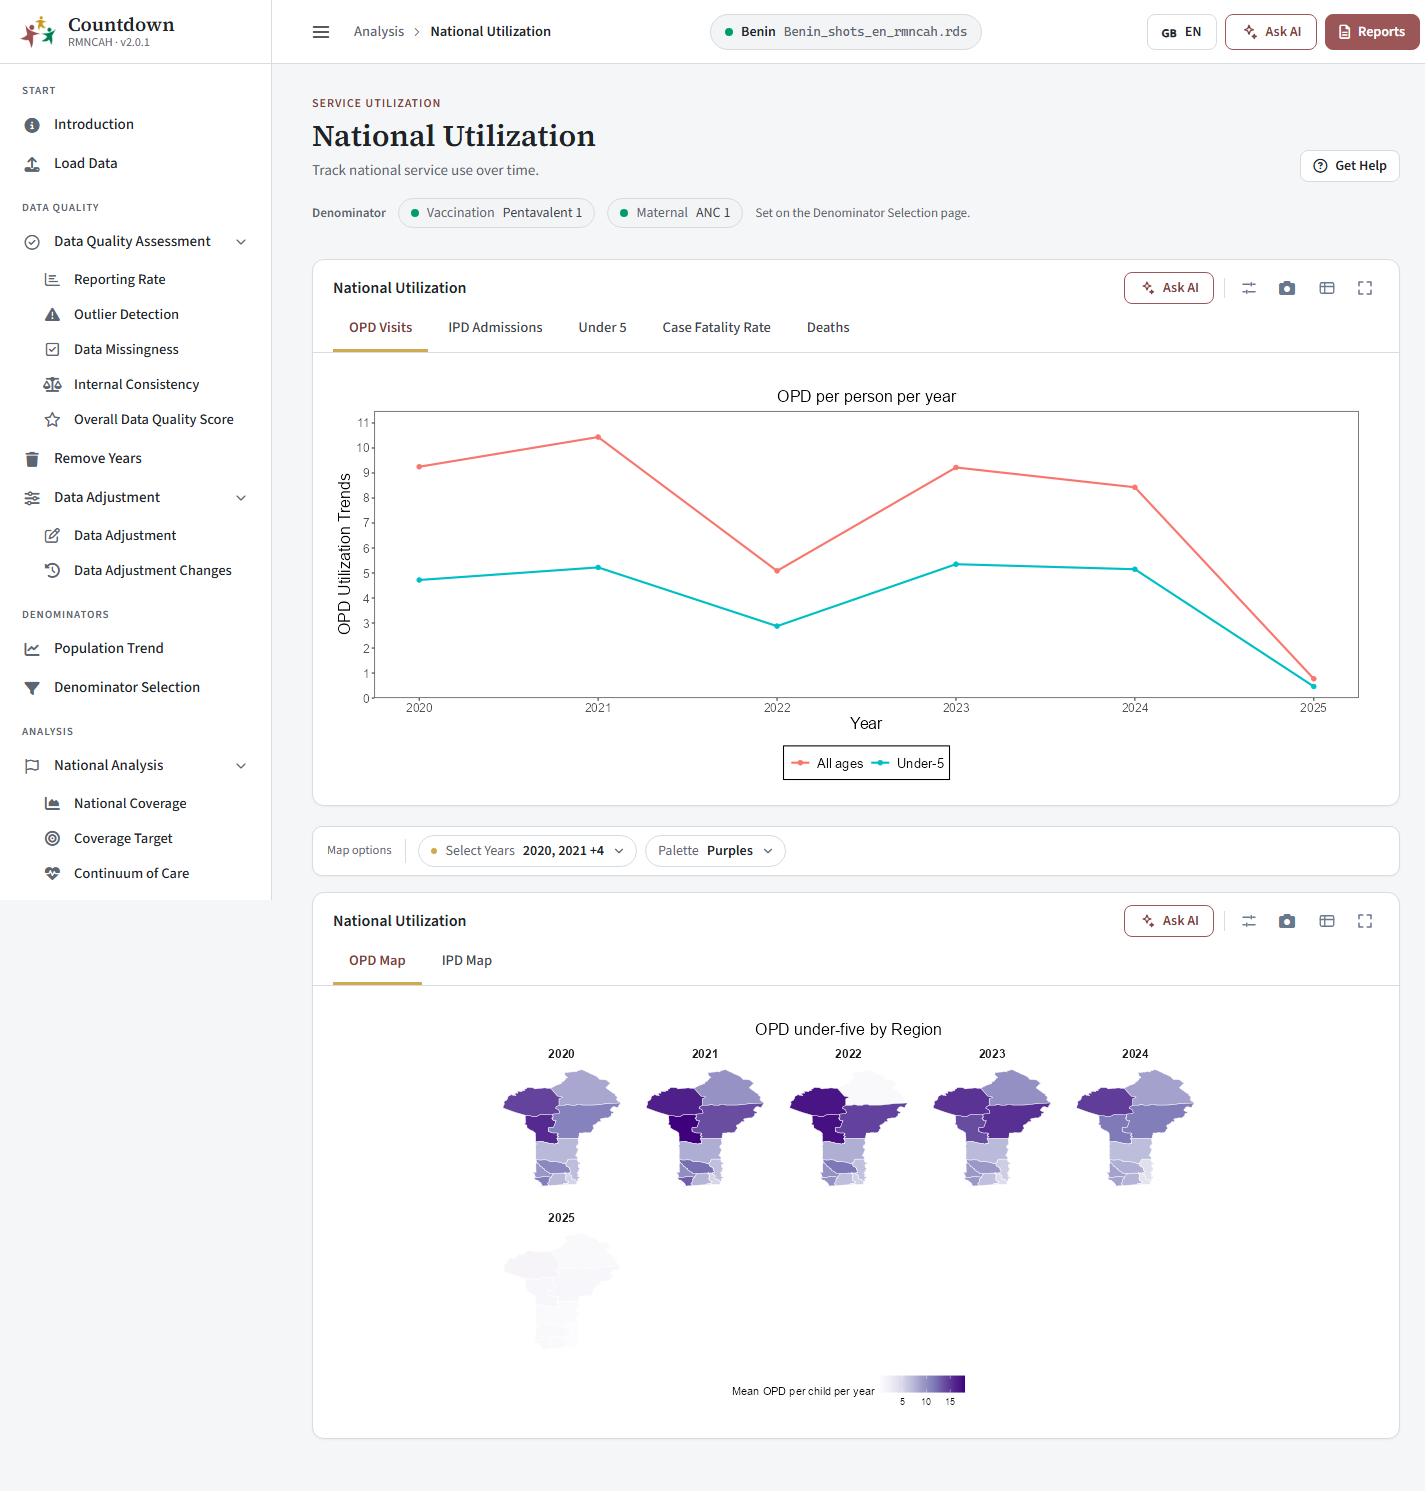 OPD visits per person per year, all ages and under 5
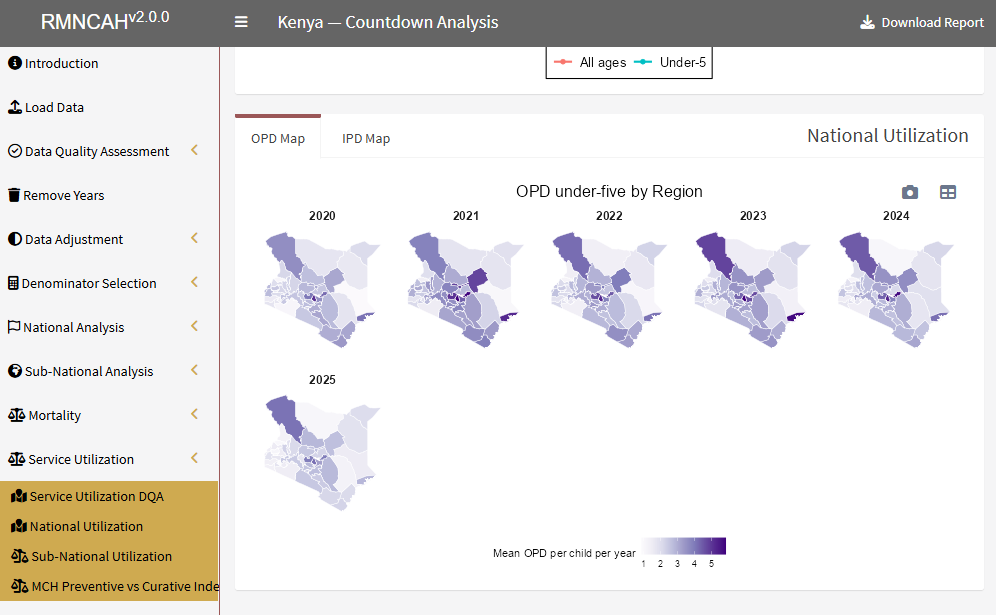 Map of under-5 OPD visits per child per year by region
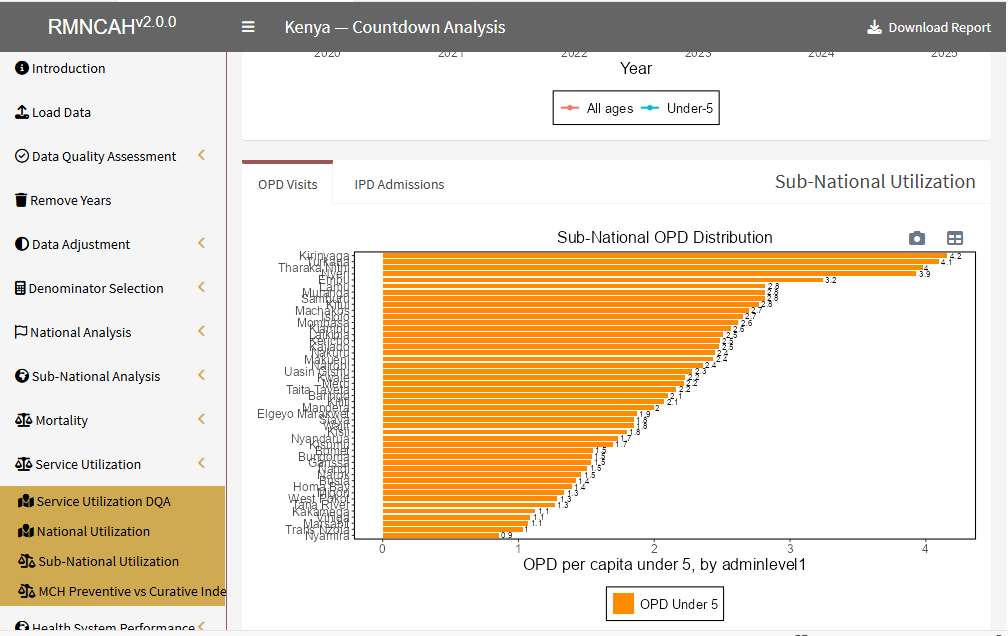 Sub-national distribution of under-5 OPD visits per capita by region
OPD interpretation considerations:
When compiling the interpretation narrative for the OPD sub-module, answer the following evaluation questions directly:
- Data quality baseline: What can be concluded about the data quality for OPD visits? Is there a high level of consistency in the reported raw numbers between consecutive years?
- Temporal trends: What is the exact calculated number of OPD visits per child per year across the 2019–2023 timeline, and is it demonstrating an upward trend?
- Access barriers: Is the national or sub-national rate lower than 1 visit per year, confirming low access to services?
- Geographical disparities: What do the data reveal about OPD visits per child per year across different regions or provinces in 2023? How large is the absolute margin between the top-performing and bottom-performing sub-national units?
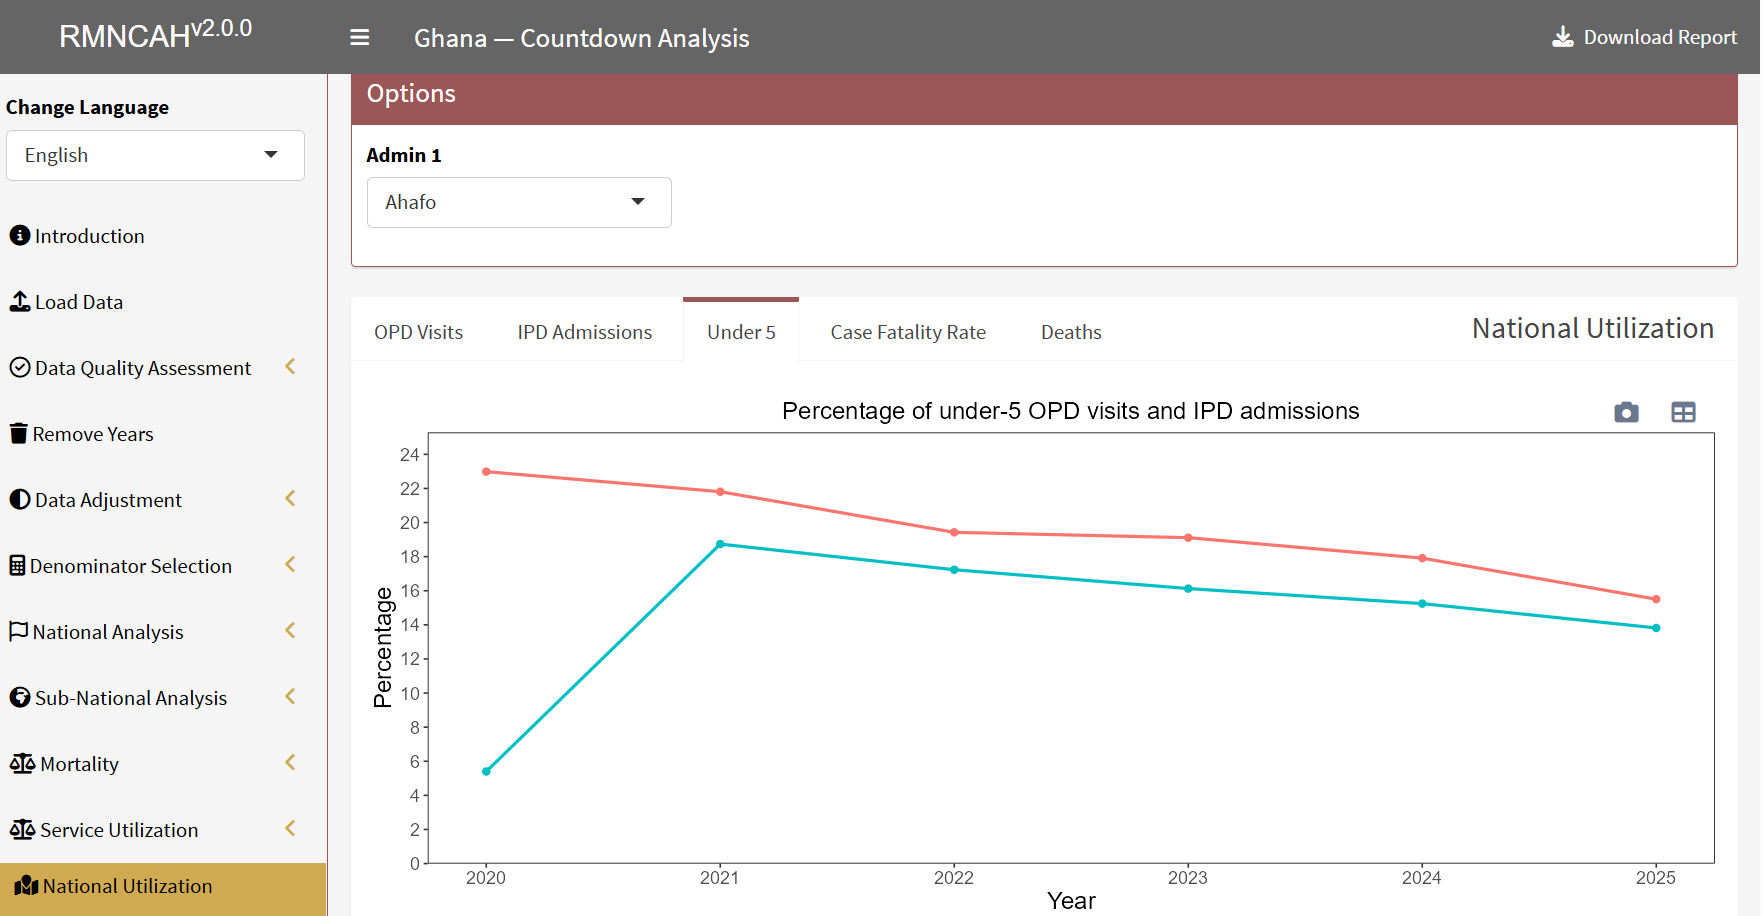 Percentage of under-5 OPD visits and IPD admissions by year
Inpatient admissions and case fatality
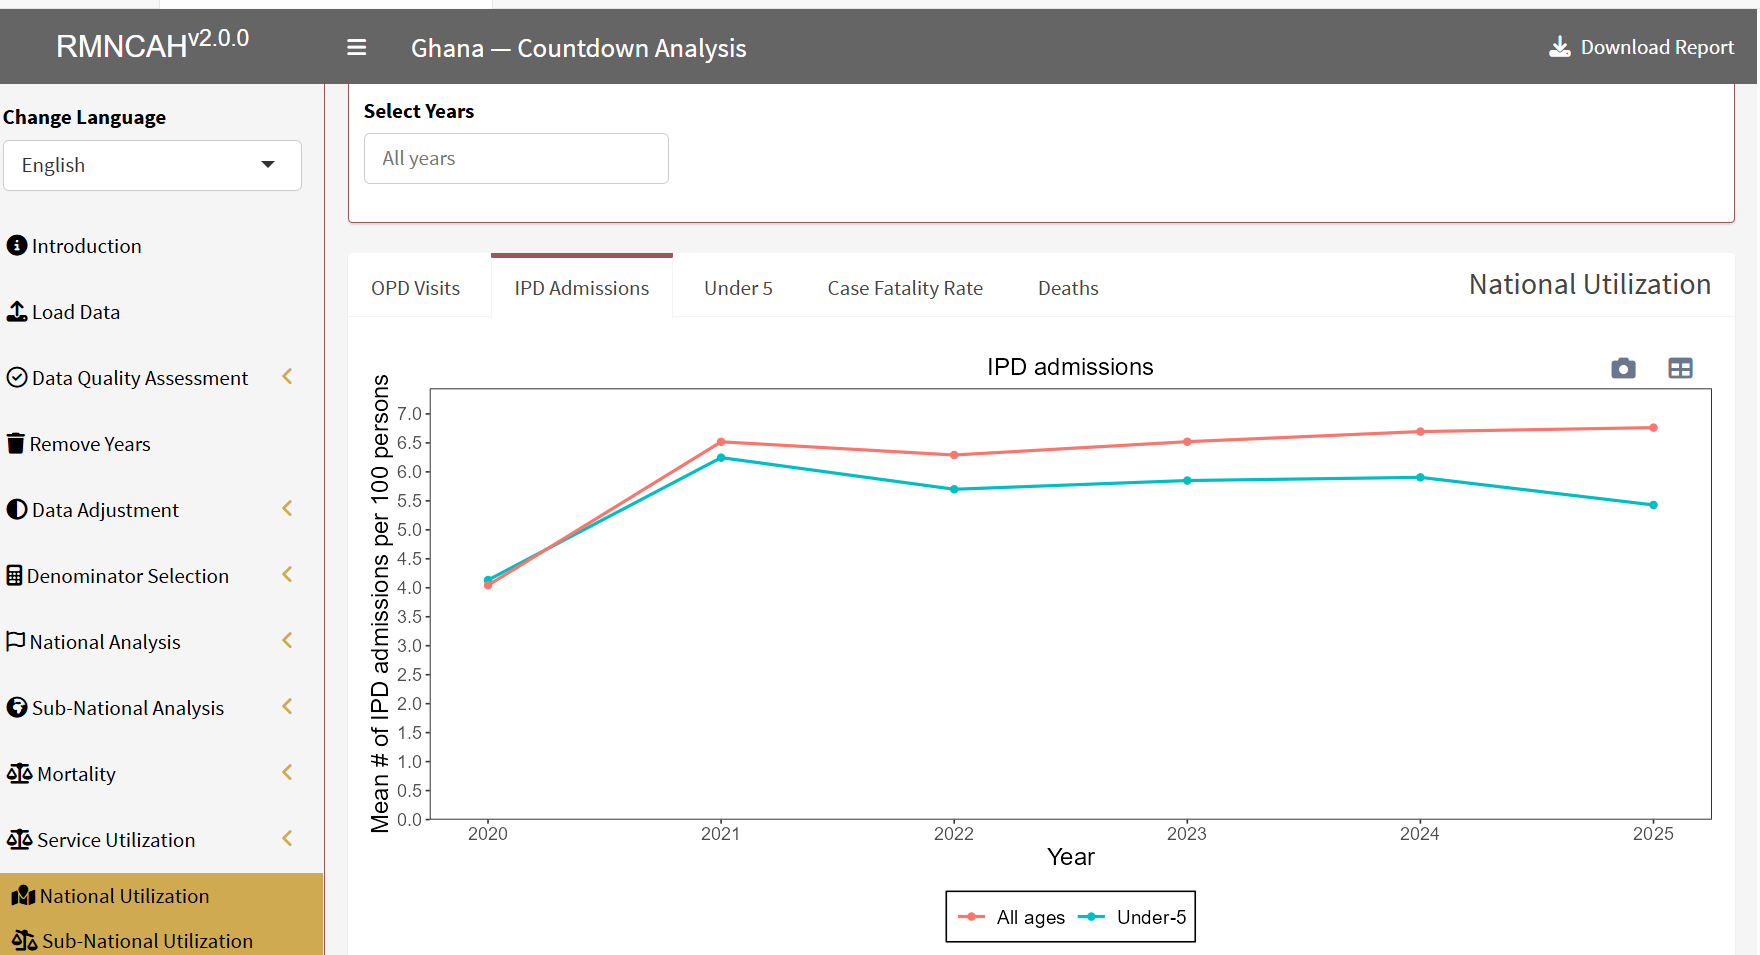 IPD admissions per 100 persons by year, all ages and under 5
IPD interpretation considerations:
Your narrative analysis for the inpatient sub-module must explicitly evaluate the following parameters:
- Data consistency: Is there internal consistency in the reported raw numbers of admissions and overall admission rates over time?
- Access metrics: What is the absolute number of admissions per 100 children under 5 per year across the 2019–2023 trend lines?
- Sub-national spread: Is the observed rate high or low compared to historical benchmarks? What specific sub-national patterns emerge when evaluating admissions per 100 children under 5 across regions or provinces?
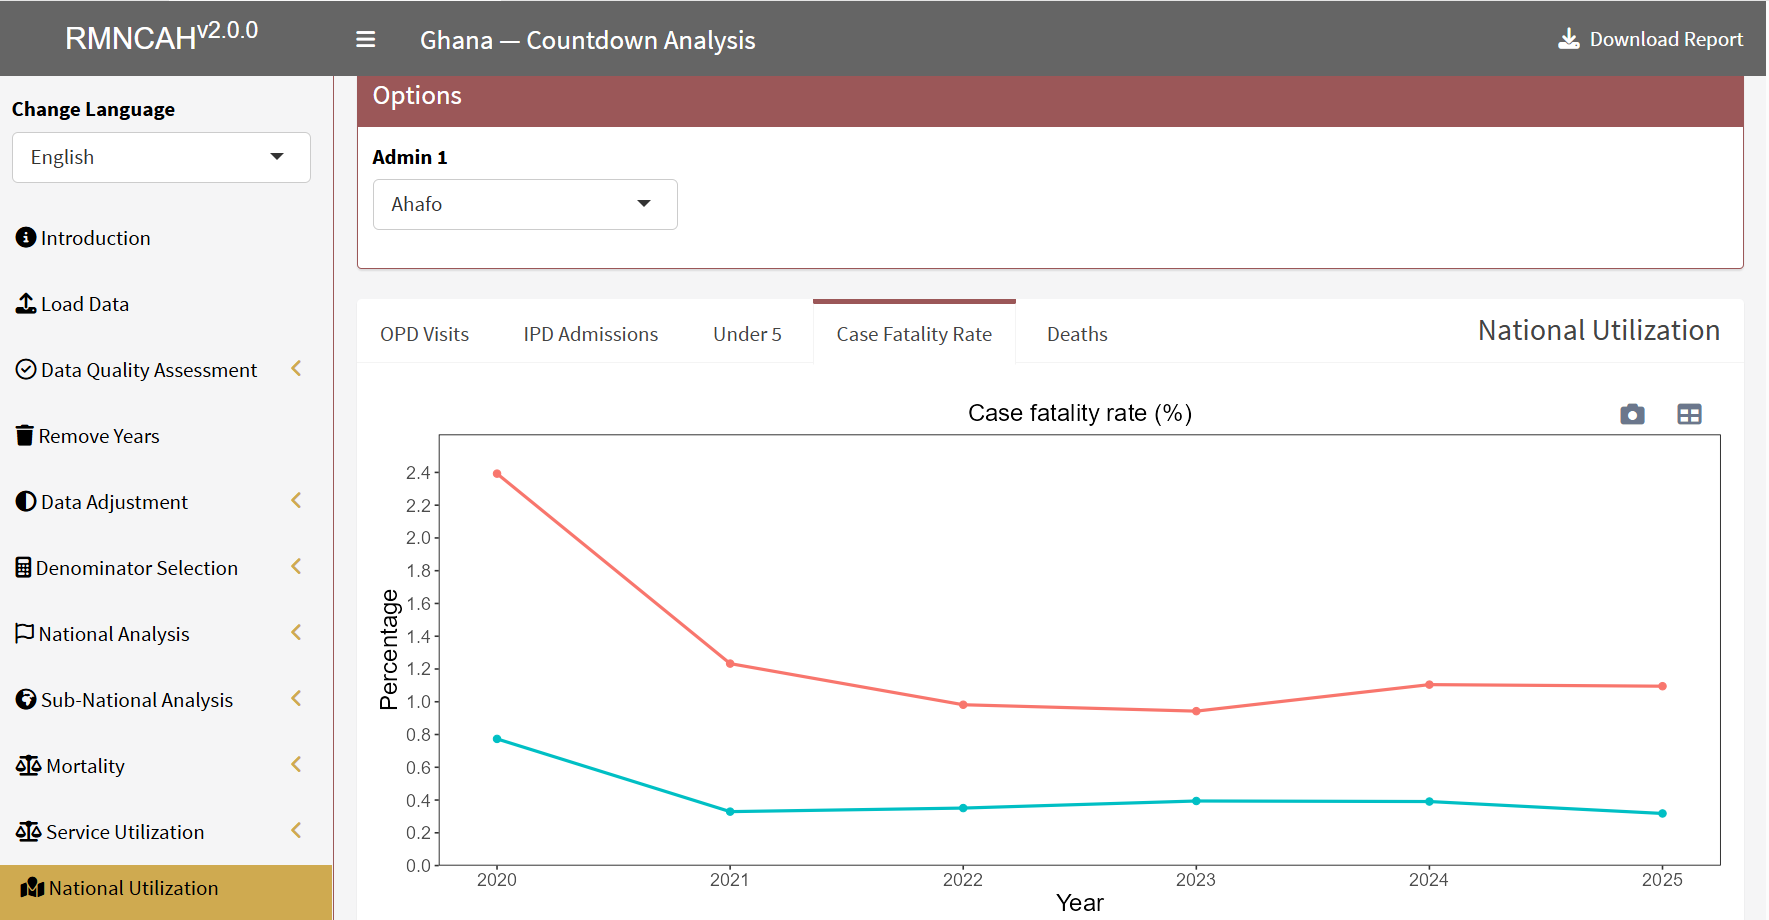 Case fatality rate (%) by year
Reading the MCH preventive vs curative index
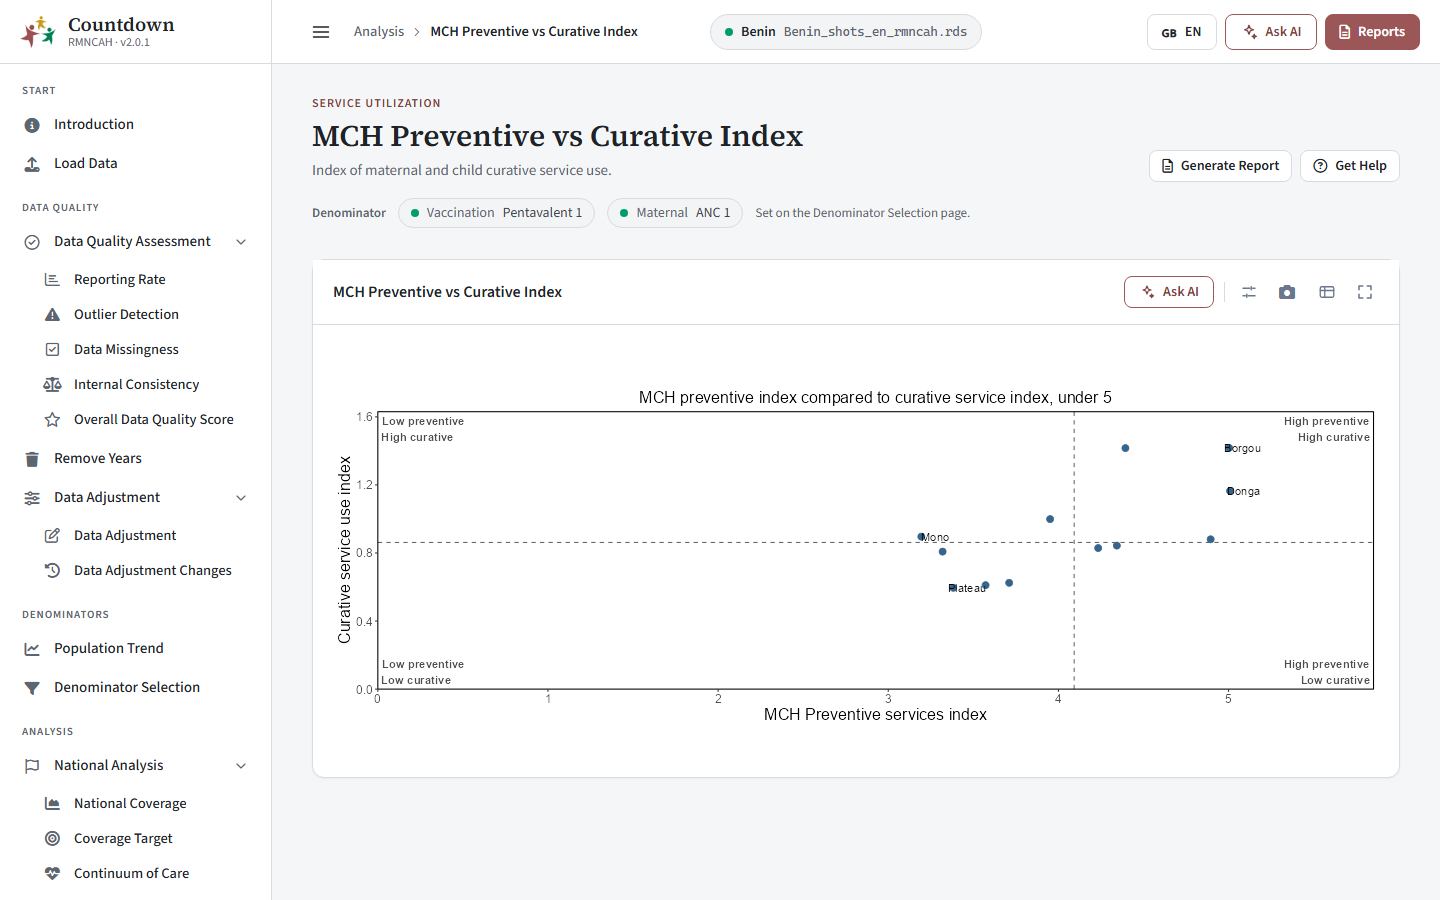 MCH preventive versus curative index
Regions with low preventive and low curative use are the priority; high curative use with low preventive use may show that people reach facilities only when ill.
Common pitfalls
- Reading utilization trends without checking the data quality first (Service Utilization DQA). If completeness or missingness is poor, treat utilization trends with caution.
In the apps
Service utilization is analysed in the RMNCAH app only, in the Service Utilization group of the Analysis section, after Data Adjustment has been run. Service utilization and health system describes each screen.
Check the data quality
Open Service Utilization DQA to judge whether the OPD and IPD data are good enough to interpret.
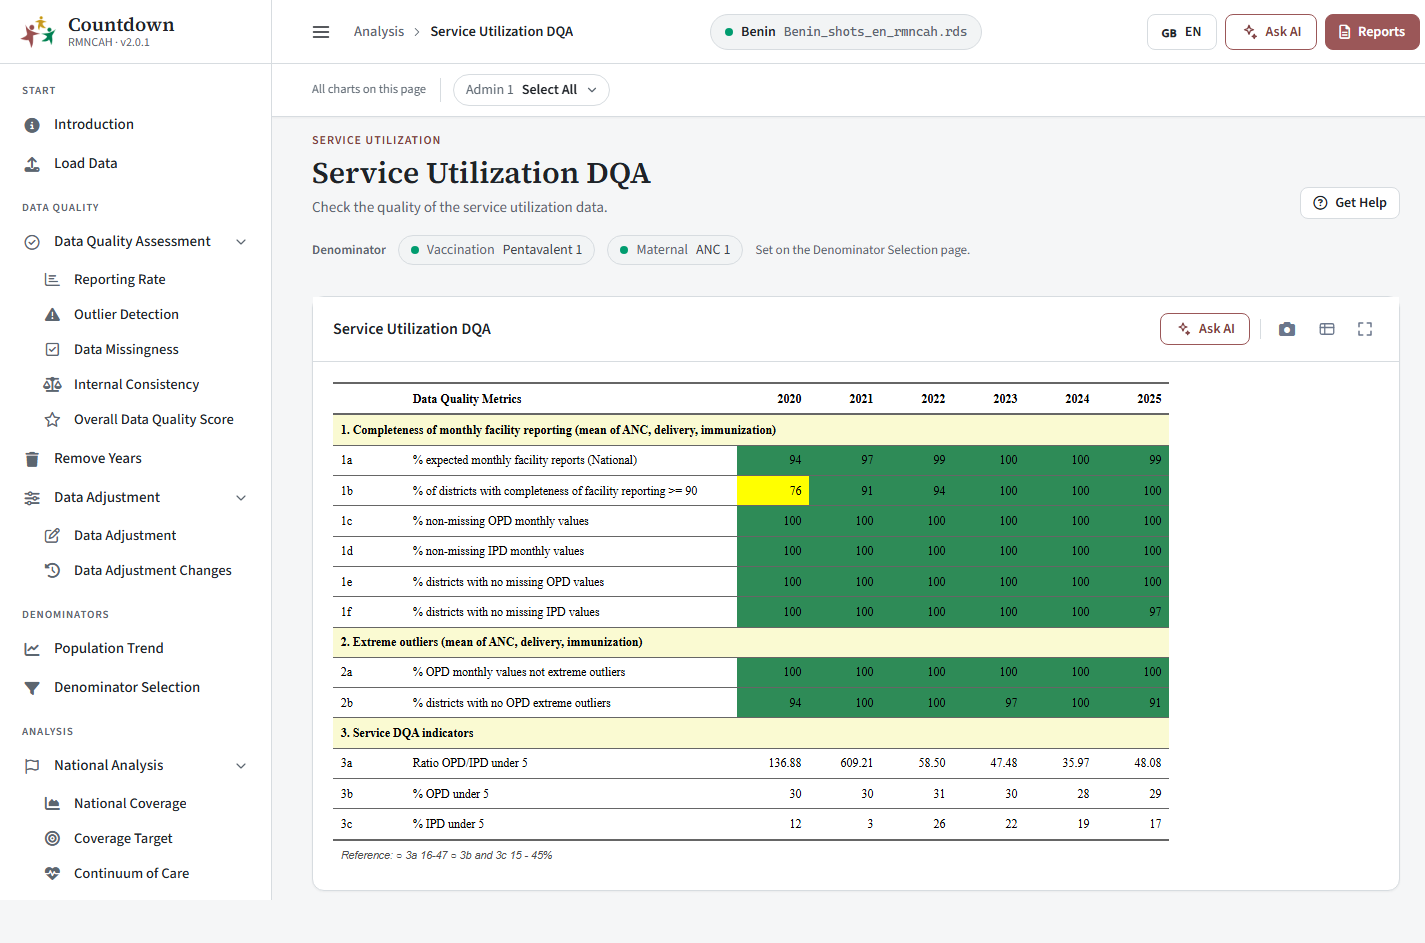 Service utilization data quality assessment table
Read national and sub-national utilization
National Utilization shows OPD visits, IPD admissions, the under-5 shares and the case fatality rate, with maps by region. Sub-National Utilization shows the same for a chosen region, and the distribution across Admin 1 regions.
Compare preventive and curative use
MCH Preventive vs Curative Index places each Admin 1 region by its use of preventive and curative services.
See also
- Formulas: service utilization and health system
- Data adjustment: adjustment for incomplete reporting and extreme outliers
- Glossary
- Previous: Mortality · Next: Health system performance