Advanced analysis
This page applies to the RMNCAH app only.
Three analyses go beyond the basic coverage charts: Bayesian Analysis, Continuum of Care and FPET FP Projection. They build on the adjusted data and the denominators you selected, so finish Data preparation and Denominators first. Methods: Bayesian modeling approach and National coverage.
Bayesian Analysis
Purpose. Combine survey data and routine facility data into one estimate per year, with a range of uncertainty and a short-term forecast. How the model uses each source: Bayesian modeling approach > How are survey data used? and How are routine data used?
When to use it. See Bayesian modeling approach > Why it matters.
There are two entries in the Bayesian Analysis group of the sidebar: National Analysis and Sub-National Analysis (regions).
Open Bayesian Analysis
Choose National Analysis or Sub-National Analysis.
Pick an indicator tab
ANC 4 Visits, ANC 1st Trimester, Institutional Deliveries, Measles 1 or Pentavalent 3. The model is defined for these five indicators.
Read the chart
The title is Bayesian Coverage Model Estimates followed by the indicator, and the source note reads Survey Data & DHIS2 Routine Data. The central line is the best estimate; the band is the uncertainty range. Use Download Plot and Download Data in the toolbar.
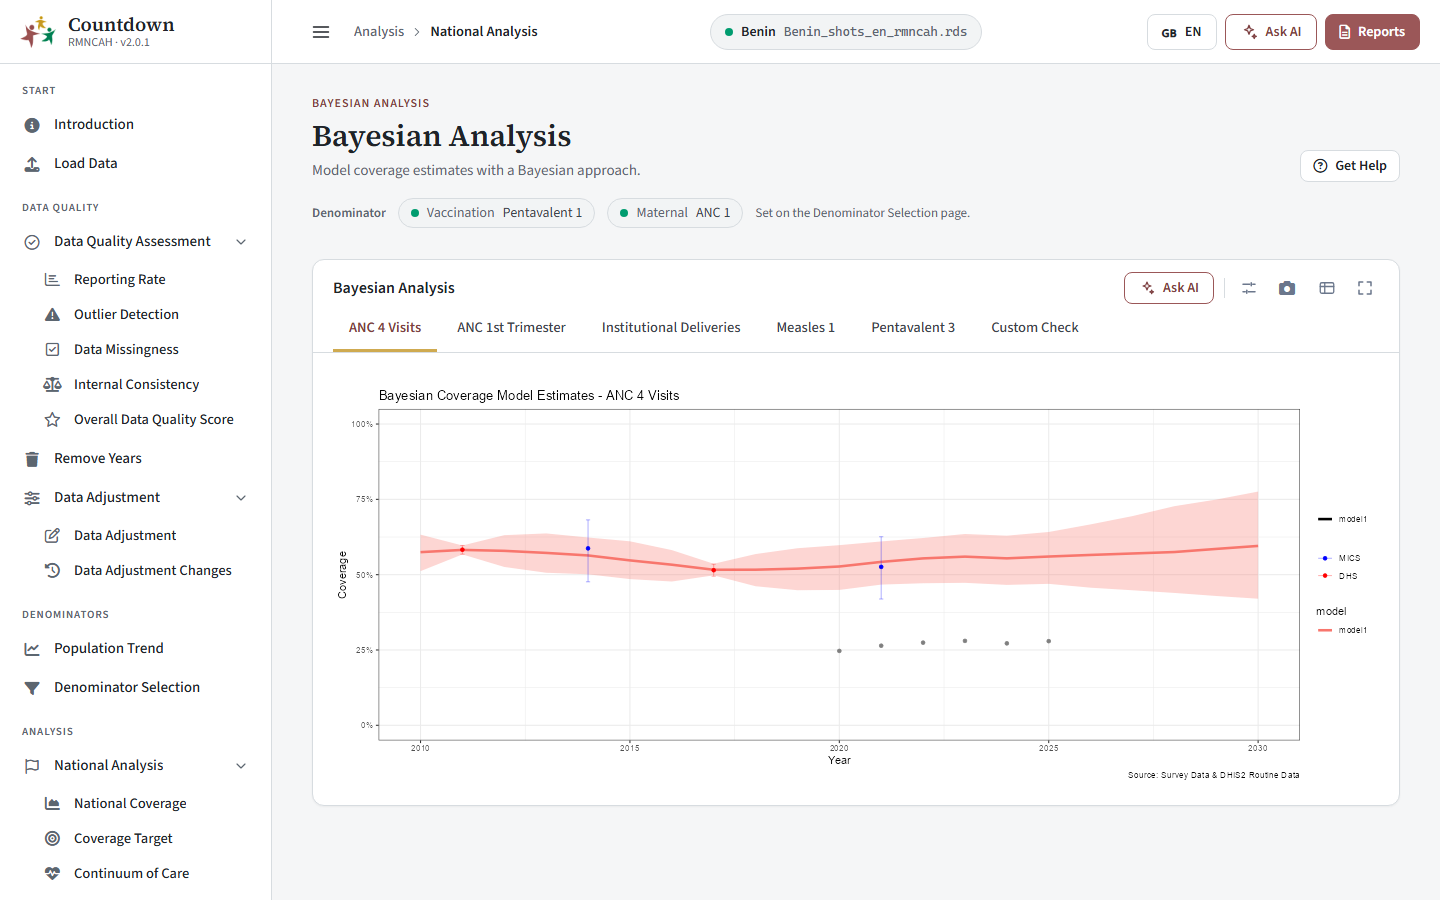 Bayesian ANC4 estimates at national level
 Bayesian ANC4 estimates by region
How to interpret. See Bayesian modeling approach > Reading the estimates and the illustrative examples.
Continuum of Care
Purpose. Follow coverage along the care pathway and see where women and children drop out.
Where. National Analysis, Continuum of Care in the sidebar. The page has two cards, both titled National Coverage & Continuum, each with the tabs Maternal Continuum and Child Continuum.
- Top card, continuum profile. National continuum-of-care profile: the latest facility value, the latest survey value and, where relevant, the WUENIC value for each step of the selected pathway, for example ANC 1st Trimester, ANC 4 Visits, Institutional Deliveries and PNC within 48 hours for the maternal continuum, or Pentavalent 3 and Measles 1 for the child continuum.
- Bottom card, continuum heatmap. Subnational continuum heatmap: the same steps for each Admin 1 region. Read across a row to see one region, down a column to see one indicator. Red cells are low coverage, yellow intermediate and green high.
The page can generate the national coverage report with Generate Report.
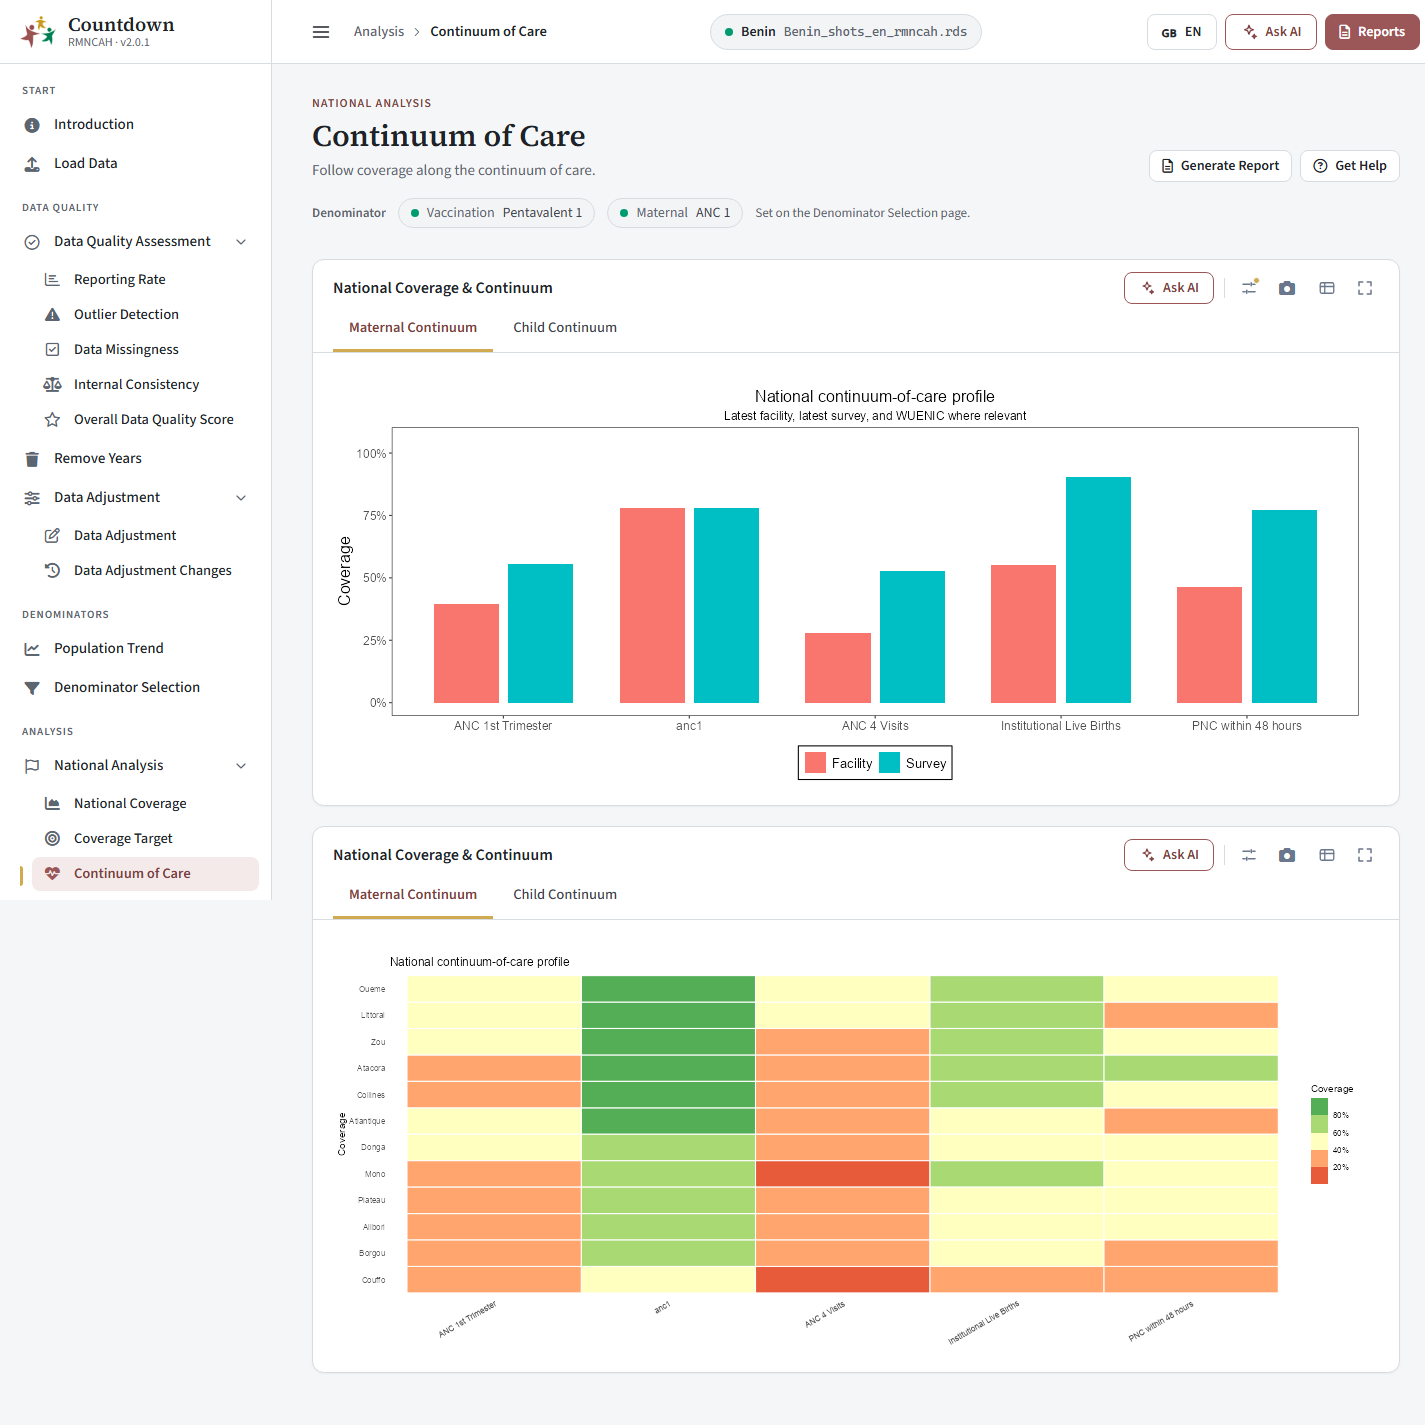 Continuum of care profile
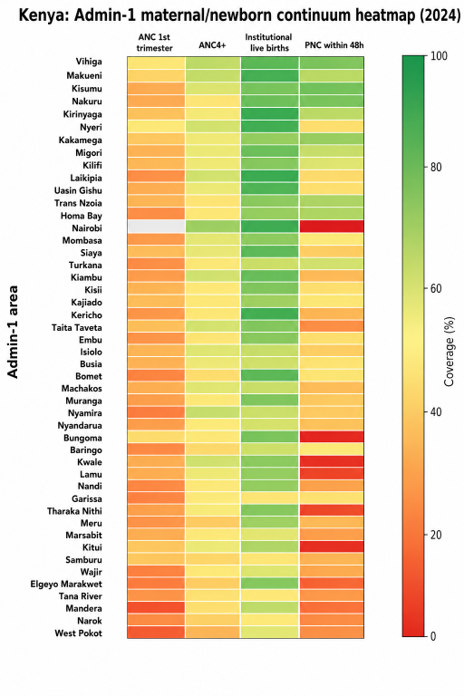 Maternal continuum heatmap by region
How to interpret. See National coverage > Interpreting the maternal continuum, Interpreting the child continuum and Continuum of care at subnational level.
FPET FP Projection
Purpose. Show family planning trends for currently married women aged 15 to 49, from the Family Planning Estimation Tool (FPET, Track20).
Where. It is the FP Projection tab on National Coverage and on Sub-National Coverage.
The chart title is Family planning among currently married women 15-49 years. It draws two indicators: Prevalence of Modern Methods (mCPR) and Demand Satisfied with a Modern Method.
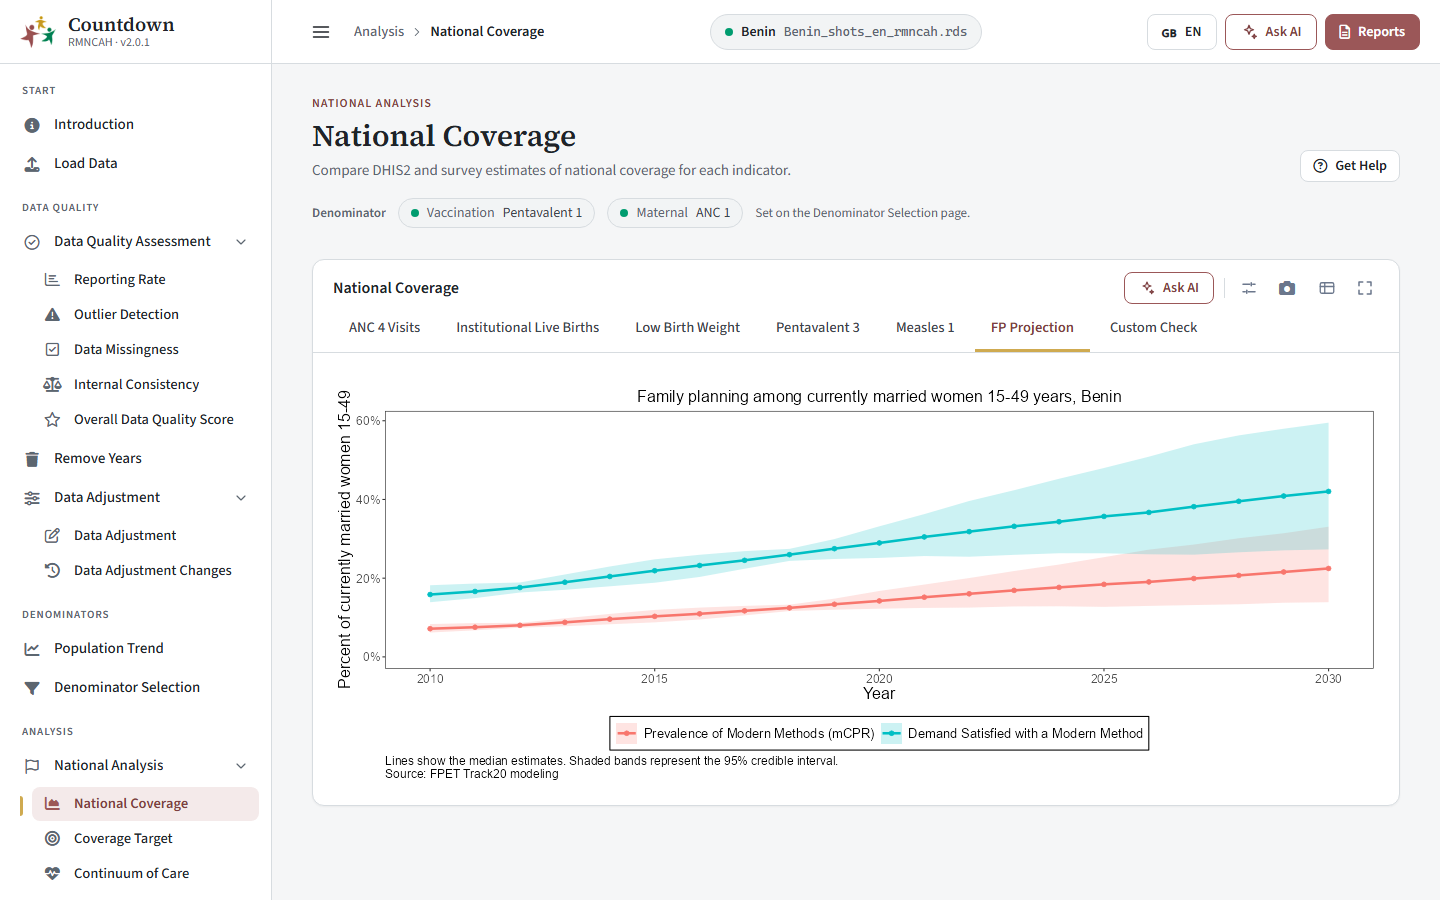 FPET projection
How to interpret. See National coverage > Family planning projections; where the data come from: Family planning.
Common pitfalls
- Pitfalls in using the Bayesian estimates: Bayesian modeling approach > Common pitfalls.
- Pitfalls in reading the FP Projection and the continuum heatmap: National coverage > Common pitfalls.