Mortality
This page applies to the RMNCAH app only.
The Mortality group looks at deaths recorded in health facilities: institutional maternal mortality, stillbirths and neonatal deaths before discharge. It has three pages: Institutional Mortality, Mortality Mapping and Mortality Completeness. The method, definitions and formulas are in Mortality.
Mortality figures use the reported numbers of deaths without the reporting-rate and outlier adjustment applied to other indicators (why: Mortality > iMMR and iSBR review). They still depend on the denominator you selected (live births or births). If a value looks like a data entry error, check it in Outlier Detection and treat it with the methodology’s guidance (Outlier detection thresholds).
Institutional Mortality
Purpose. Show the level and trend of institutional mortality and check whether it is plausible.
When to use it. First, to see the rates; then use the second card to test data quality.
Open Institutional Mortality
It is under Mortality in the Analysis group.
Read the first card, Institutional Mortality
Tabs: Maternal Mortality (per 100,000 live births in facilities), Still Birth Rate and Neonatal Deaths. Dots are regions and the line is the country, by year.
How to read it: Mortality > Institutional mortality levels.
Read the second card, Institutional Mortality DQA
Tabs: Fresh Stillbirths (fresh stillbirths as a percentage of all stillbirths), SBR to Maternal Death Ratio (stillbirths per maternal death) and Neonatal / Maternal Deaths (institutional neonatal deaths per maternal death). Each chart shows the Median and an Expected range, and a note under the chart gives the range.
The ranges and how to read them: Mortality > Expected ranges on the DQA charts and Reading the DQA checks.
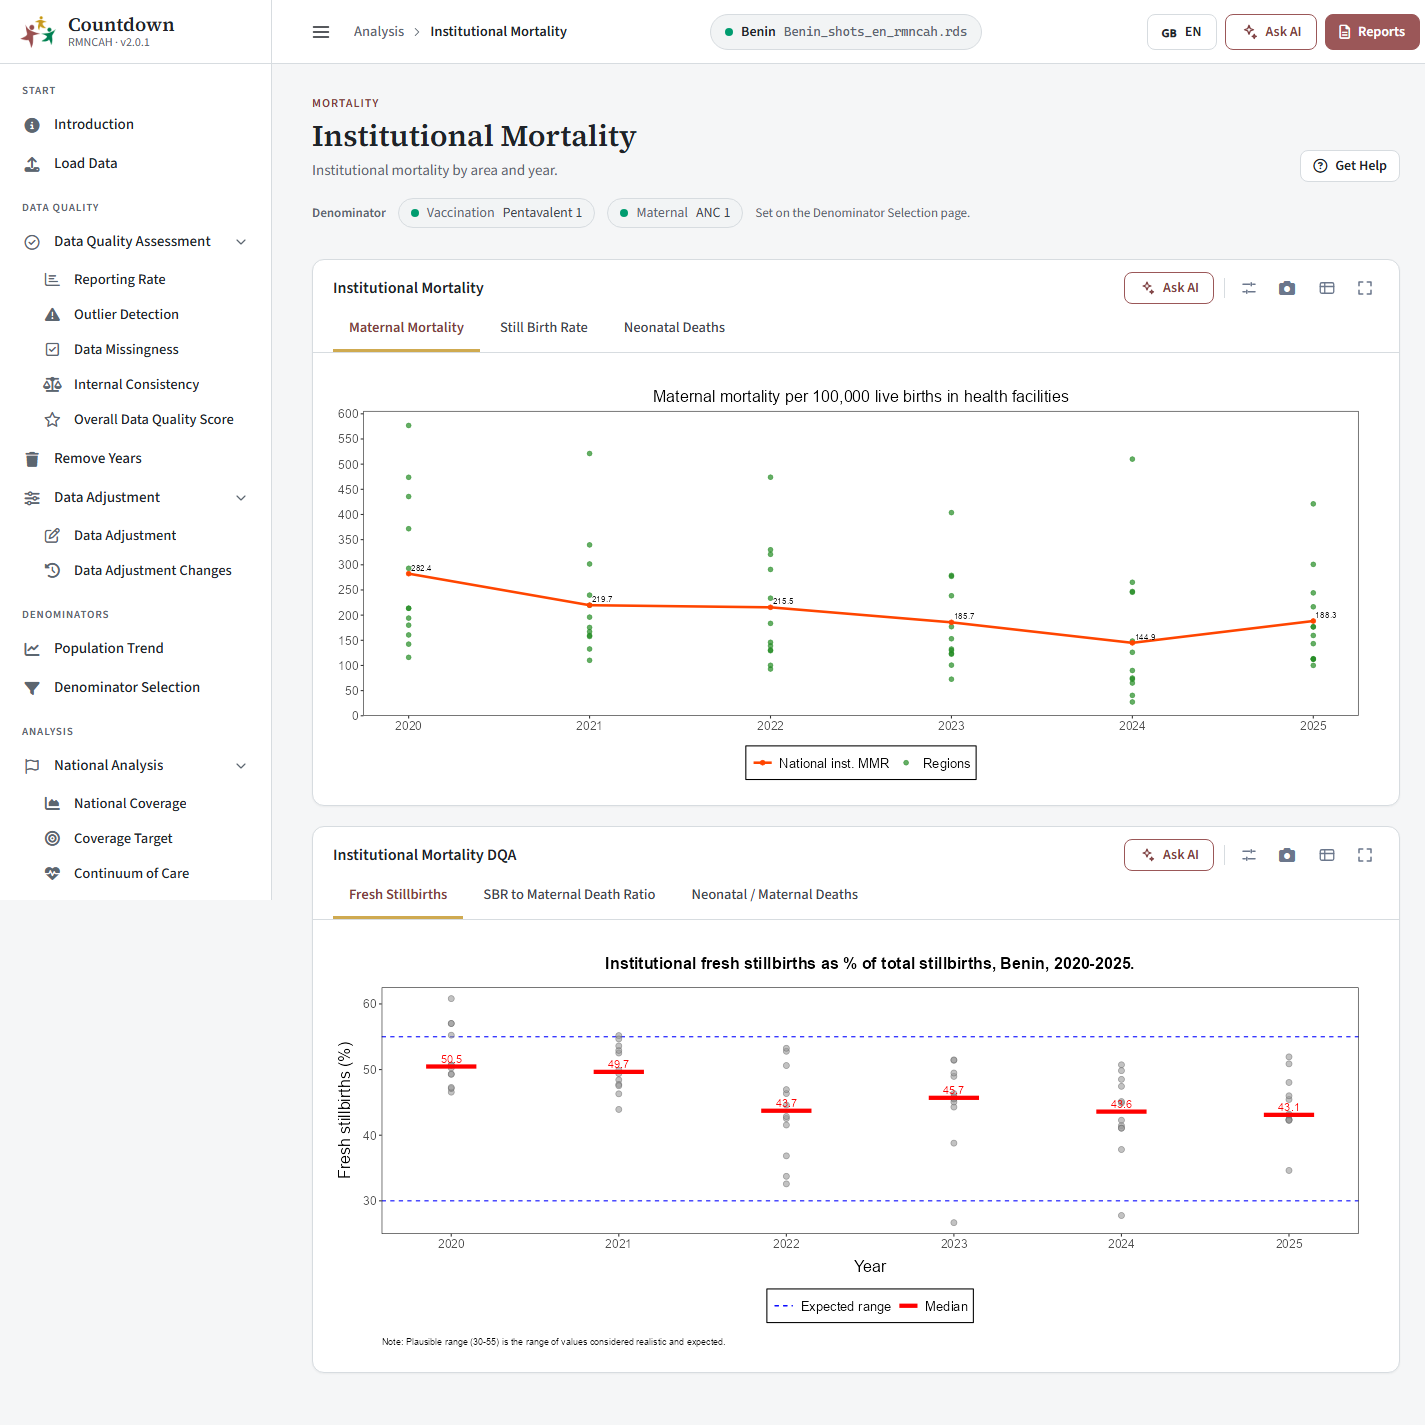 Institutional maternal mortality by region and year
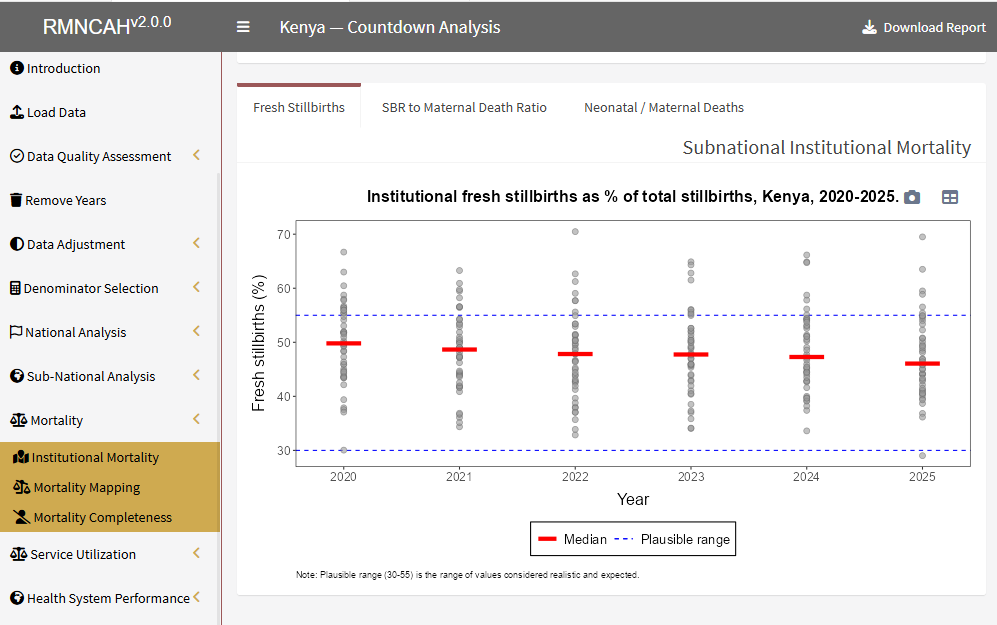 Fresh stillbirths as a percentage of total stillbirths
How to interpret. See Mortality > Reading the DQA checks; for neonatal deaths before discharge, Considerations for iSBR.
Mortality Mapping
Purpose. Map institutional mortality across regions.
Filters. Select Years (one or several) and Palette (Greens, Blues, Reds or Purples; the default is Reds).
Tabs: Maternal Mortality and Still Birth Rate. Each map shows the values by region for the selected years, which makes geographic clusters visible.
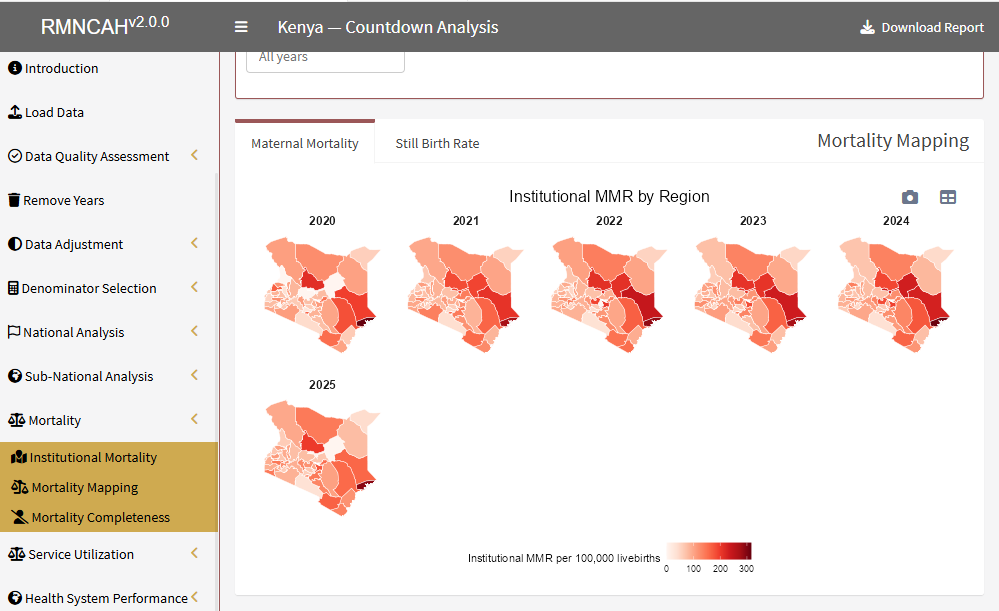 Institutional maternal mortality by region
How to read the map: Mortality > Geographic distribution.
Mortality Completeness
Purpose. Estimate how completely facilities report deaths, by comparing the reported institutional rate with an expected rate built from UN estimates.
When to use it. After the DQA charts, to judge whether reported mortality can be used at all.
Tabs: Institutional MMR and Institutional SBR. Each chart draws completeness for the lower bound, median and upper bound of the UN estimate, across several assumptions about how much higher community mortality is than institutional mortality. Use Generate Report to open the mortality report.
How it is computed: Mortality > Computing reporting completeness. How to narrow the scenarios with local evidence: Evaluation scenarios and interpretation.
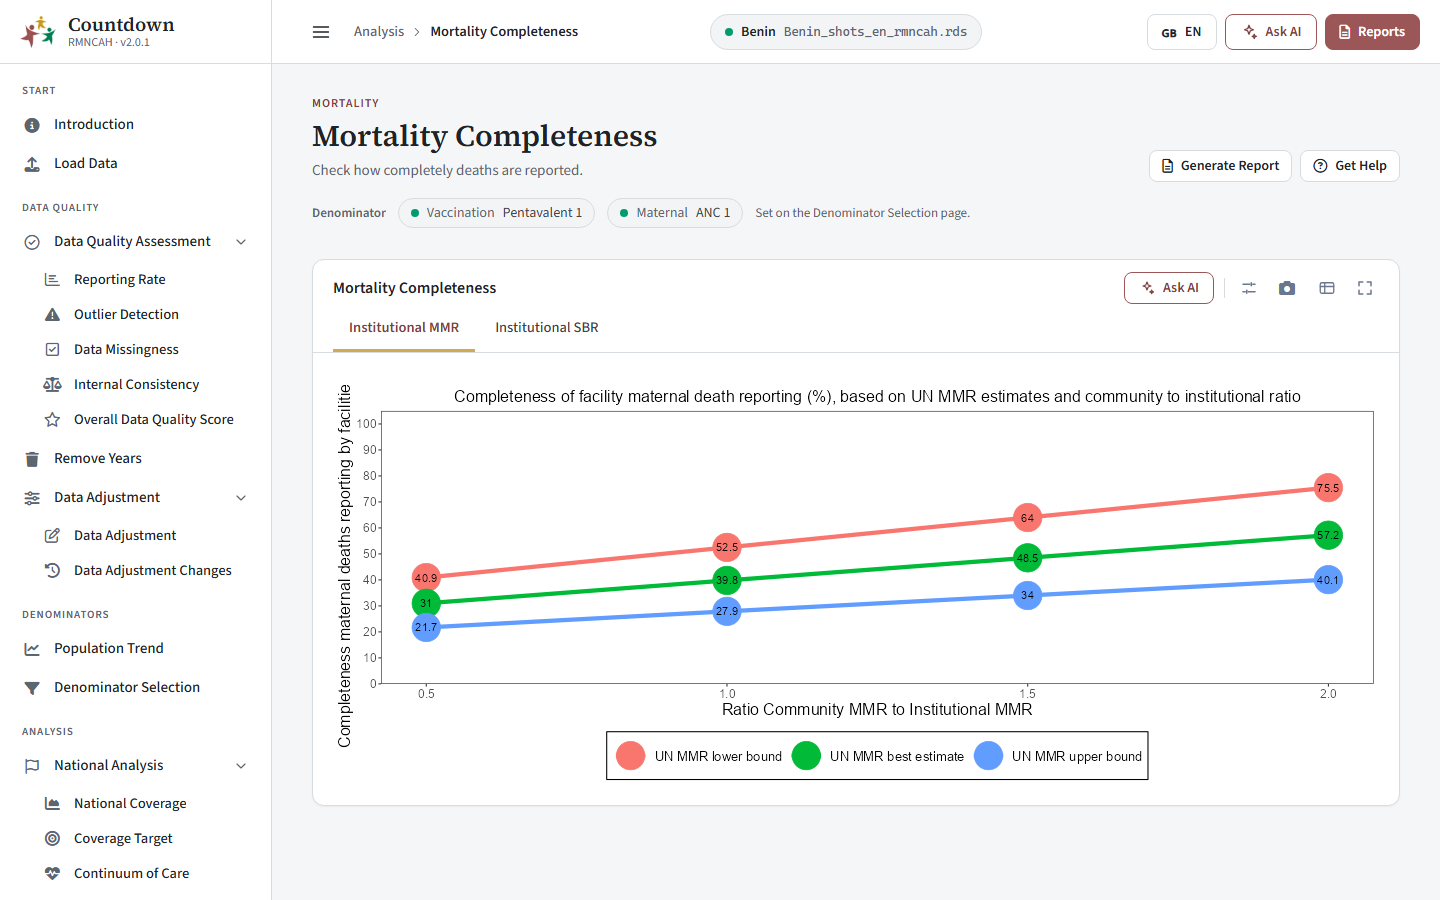 Completeness of facility maternal death reporting
Completeness relies on the UN mortality estimates. Use the built-in country data, or upload your own in the Upload Data step of Getting started.
Common pitfalls
Pitfalls in interpreting institutional mortality: Mortality > Common pitfalls.