Planning for dissemination, decisions and action
The objective of the final session of the workshop is to identify concrete actions to take forward the work you have completed. As you have been preparing and interpreting your analyses, you have been encouraged to think about the full cycle of data-driven decision-making.
At a glance
- Answers: Who will use the findings, for which questions, and which concrete actions will take the work forward?
- Uses: the analysis, interpretation and key findings from the previous steps (see the end-to-end workflow).
- Produces: information products and dissemination strategies tailored to users, and actions for data use, capacity building and further analysis.
- In the apps: Reports and Exports, reports and AI.
Why it matters
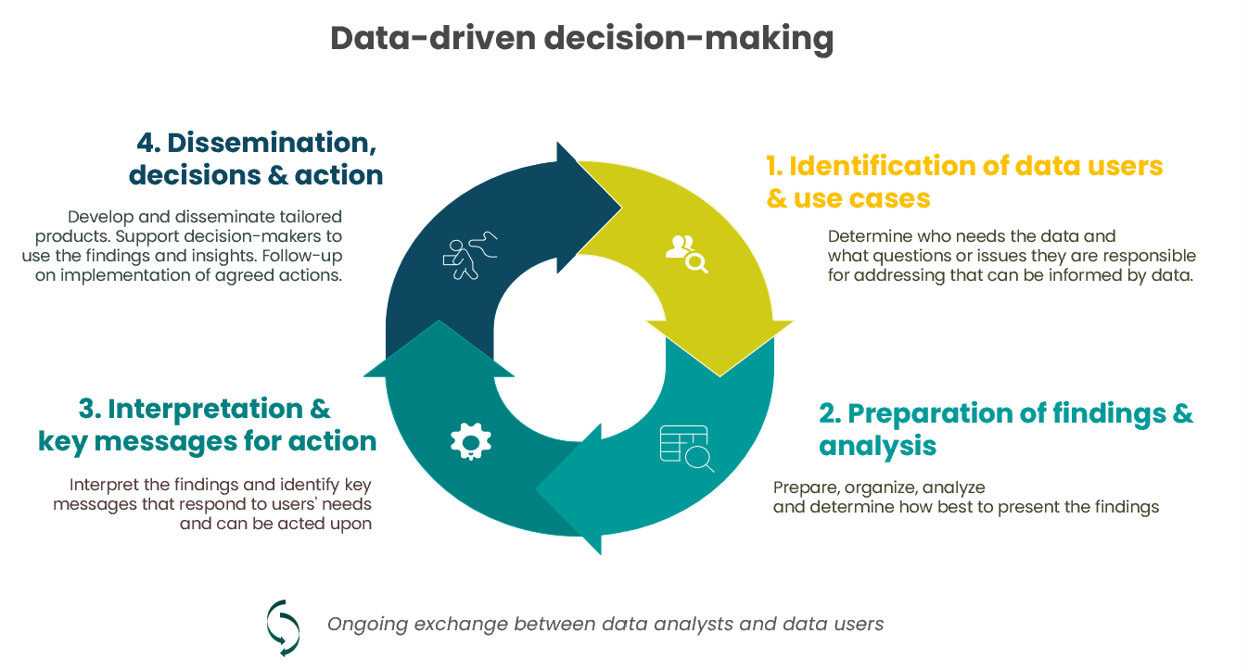 Cycle of data-driven decision-making
This starts with identifying the data users and understanding the questions or issues they aim to address, and then preparing the analysis, interpretation and key findings that would be most useful for addressing those questions or issues.
Information products and dissemination strategies should be tailored to align with users’ preferences and should be supplemented with support to decision-makers in using the analysis and following up on agreed actions.
Method
Key considerations
- Identify use cases and audiences
- Use appropriate dissemination platforms
- Integrate into routine decision-making forums
- Link to Ministry of Health reviews and reporting processes
Purpose of the activity
These activities outline how analysis outputs can be translated into action, capacity strengthening, and further research within the CD2030 framework.
Supporting data use and action
View examples
- Present findings, interpretation and key insights to the country RMNCAH platform and related technical working groups for them to review and interpret. Support them to identify opportunities to take action based on data and evidence - for example, address gender or geographic inequities, test pilots with implementation research or evaluation, advocate for policy change or resources, etc.
- Include analysis as part of evidence base to inform the development of new RMNCAH-N strategy, a mid-term review and an evaluation, if any of these are underway.
- Produce an article or analytical brief for targeted audiences with key learning, takeaways, and proposed actions following the workshop, as an entry point for follow-up.
Building capacity
View examples
- Carry out cascade training at national and district levels on the concepts, interpretation, and use of specific analyses, through the country Countdown collaboration.
- Hold sessions to sensitize national bureau of statistics staff on Countdown methodology to build ownership.
- Share the concepts and findings of health facility data quality assessment with HMIS and M&E staff to build their understanding and as an opportunity for strengthening routine systems for data quality.
- Build HMIS and M&E staff capacity to understand the relevance of gender and equity-related indicators and analyses.
- Build capacity of staff to incorporate some of the new analytical techniques and approaches into dashboards, policy briefs, statistical reports, etc.
Identifying needs for further analysis
View examples
- Identify opportunities for implementation research to address bottlenecks or to inform potential scale-up/replication of successes based on findings from the analysis.
- Identify opportunities for further research or analysis in order to better understand trends in gender and equity that were observed in the analysis and to inform options for action.
Information products
Two products of the apps’ standard reports are the ones most stakeholders ask for:
- The synthesis chartbook is the complete analysis in one document for the review meeting.
- The sub-national one-pager gives each region its own statistical profile.
What each standard report contains, and how to build it, is in Reports.
Preparing reports for stakeholders
- Settle data quality, adjustment and the denominators (in the Vaxx App, the denominator) before you generate the synthesis, and state them in a text block on the first page.
- Answer every interpretation prompt or delete it. Leaving prompts in is the most common reason a chartbook looks unfinished.
- Fill in the cover: title, editors, date and logos of the partners.
- Produce the report in the language of the audience, and use Print layout before you send a PDF.
- Duplicate the one-pager for each region and share the PowerPoint files with the regional teams (for the Vaxx App, also the immunization managers).
- Link findings to actions: see Supporting data use and action.
Sharing charts and tables
Download the data with the plot when you share a chart. The Excel file carries the title and the numbers, so readers can check the figure.
Interpretation
Common pitfalls
- Sharing a chart without its data or the denominator. Always state the denominator and adjustment used.
In the apps
The apps turn the analysis into products you can share.
Build a report
The Reports page in the Output section builds Word or PDF documents and PowerPoint or PDF slide decks from the loaded dataset. Standard reports contain prompts headed Notes or Interpretations: replace them with the interpretation agreed at your review meeting. See Reports.
Export charts, tables and datasets
Download single charts, tables and datasets, or ask the DataSuite chat assistant about the saved dataset. See Exports, reports and AI.
See also
- Reports
- Exports, reports and AI
- Glossary
- Previous: Health system performance · Back to the framework overview