Equity assessment (equiplots)
National coverage averages mask critical disparities that determine whether health systems are truly leaving no one behind. This module uses household survey data to assess inequalities across three major dimensions: residence (urban/rural), wealth (richest-to-poorest quintiles), and maternal education. By visualizing coverage trajectories separately for each population subgroup alongside the national trend, equiplots reveal whether gaps are narrowing or widening—essential information for targeting health investments equitably.
At a glance
- Answers: Are coverage gaps between population subgroups (urban/rural residence, household wealth quintile, mother’s education) narrowing or widening, and which type of inequality do the wealth quintiles show?
- Uses: household survey data on area of residence, household wealth quintiles and the mother’s education, with the national coverage trend for comparison (National coverage).
- Produces: equiplots of each subgroup’s coverage over time alongside the national trend, and the inequality pattern (top, linear or bottom inequality) for wealth. Next: Subnational analysis.
- In the apps: Equity Assessment (in the Vaxx app, the Survey Data page under National Inequality).
Why it matters
Three distinct inequality patterns emerge from the data: top inequality (only the rich escape), linear inequality (wealth-associated gradients), and bottom inequality (poorest left behind). Each pattern signals different programming priorities: mass access campaigns, pro-poor targeting, or education initiatives respectively. Tracking these patterns over time reveals whether equity interventions work and whether your health system is progressing toward universal coverage for all population groups, not just national averages.
The scientific basis is set out in the rationale.
Method
Rationale and approach
Scientific basis for the analysis:
Household surveys provide critical information on inequalities. Our focus is on three major dimensions of inequality: area of residence, wealth and education.
For area of residence, we focus on urban/rural areas, for wealth, we use household wealth quintiles and for education we focus on education of the mother. Equiplots are used to assess whether the country has made progress since 2010 in reducing the poor-rich gap or the gap between women with no education or low education and women with higher education.
For wealth quintiles, it can be assessed what the type of inequality is, as all categories are of the same size. Each pattern requires a different strategy of health programming and targeting:
- Top inequality (mass deprivation): If the richest are well ahead of all other wealth quintiles, only the rich escape.
- Linear inequality: If the coverage differences are equidistant, this is a linear pattern where the increasing household wealth is linearly associated with higher coverage.
- Bottom inequality (marginalization): If the poorest are left behind, this means marginalization of the poorest.
Interpretation
Interpretation of equiplots
See the rationale: Equity analysis (equiplots).
The interpretation should focus on whether inequalities have reduced over time and to what extent global targets for coverage have been met. Consider your audience(s) and what key messages and insights you want to get across.
The following questions should guide and be answered by the interpretation:
- What is the level of inequality in the most recent data point?
- How have inequalities changed over time?
- Is there any inequality pattern that can be observed?
- What will be the best approaches to reduce inequalities?
How to read an equiplot:
- The distance between the points is the inequality.
- For wealth, read the pattern: only the richest ahead means top inequality, evenly spaced groups mean linear inequality, and the poorest far behind means bottom inequality (marginalisation). Each calls for a different programme response.
- Focus on the latest data point, the change since 2010 and whether the gap is closing.
Common pitfalls
- Equity charts come from survey files and can be several years old. Compare them with routine trends, not with a single year of DHIS2 data.
In the apps
Open Equity Assessment
This will be analyzed within the National Analysis -> Equity Assessment section in the Shiny app. In the Vaxx app, it is the Survey Data page under National Inequality.
Choose the Equity Type and indicator
Area, Maternal Education or Wealth Quintile, then an indicator tab (Custom, or Custom Check in the Vaxx app, for any other indicator).
RMNCAH and vaccine analyses differ here: the indicator tabs are ANC4, institutional live births, low birth weight, Penta3 and Measles 1 in RMNCAH analyses; Penta3, Measles 1 and the dropouts Penta1 to Penta3 and Penta3 to Measles 1 in vaccine analyses. See RMNCAH and vaccine analyses.
Read the equiplots
Screen by screen: Equity Assessment.
You should see the output below:
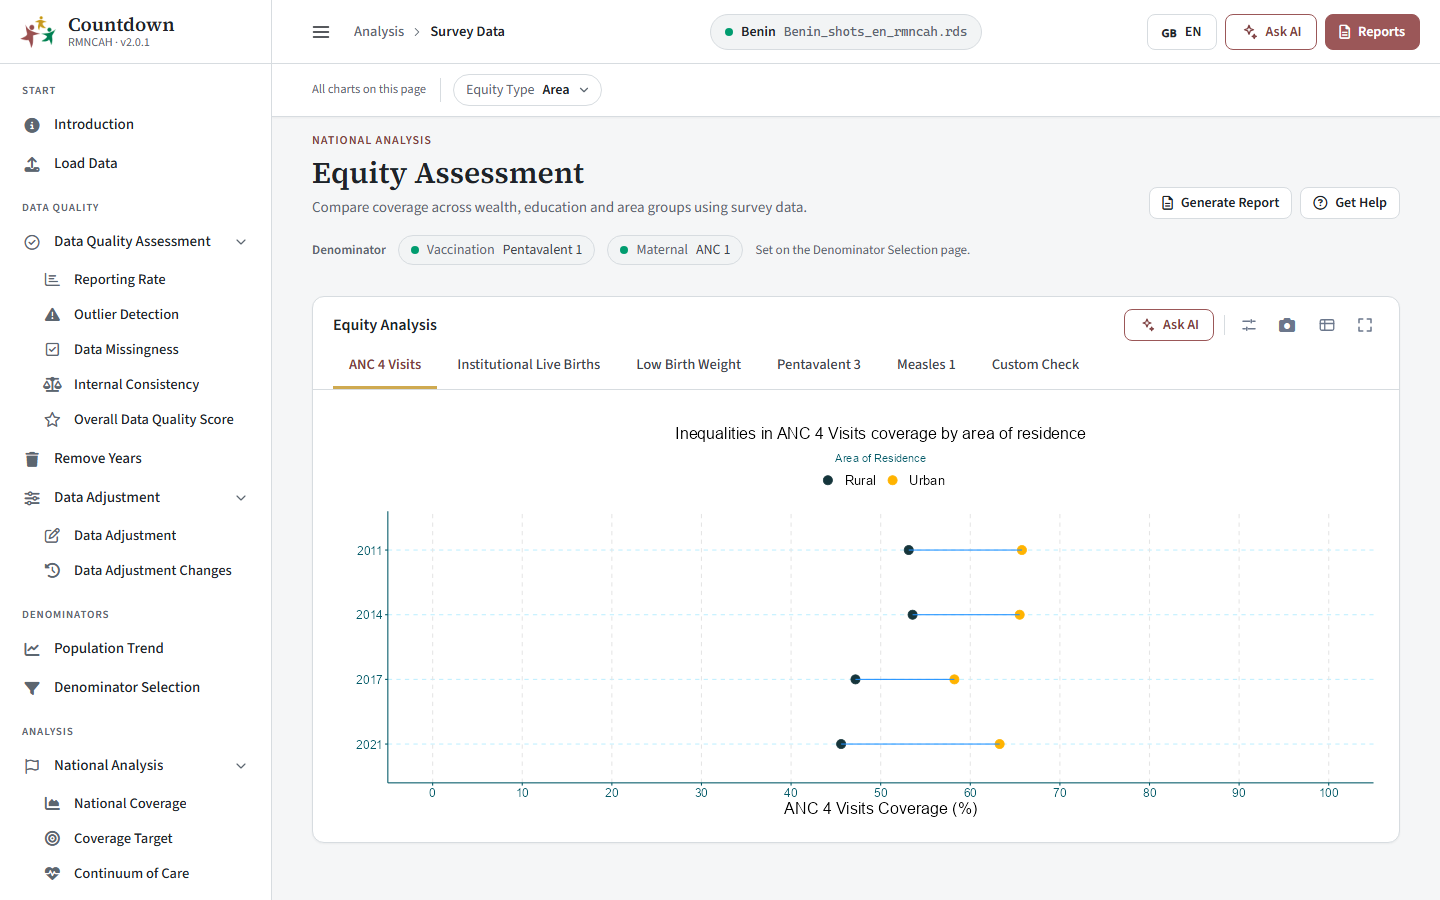 Equiplot of Pentavalent 3 coverage by area of residence
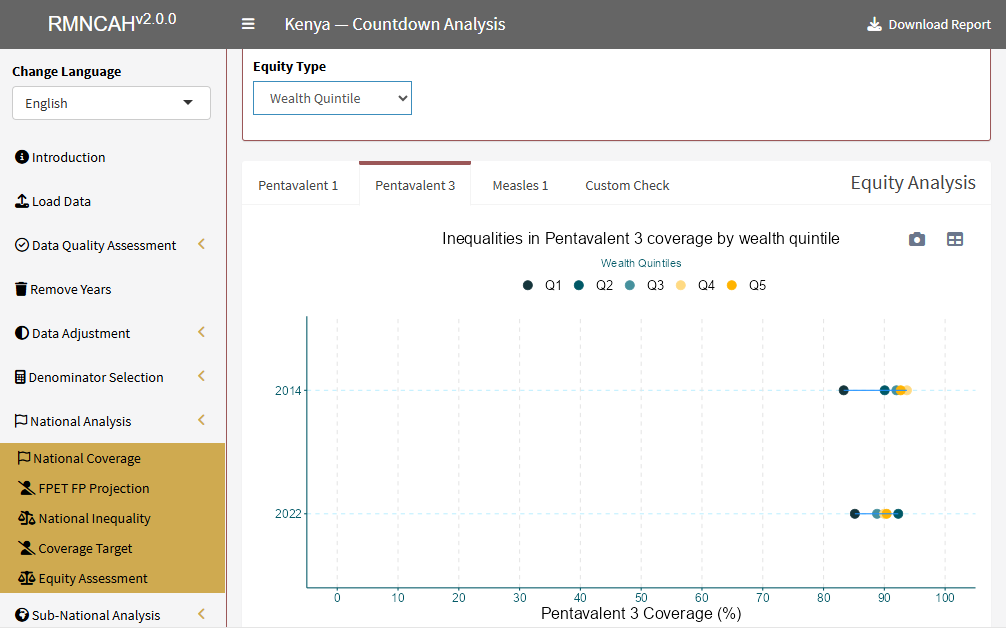 Equiplot of Pentavalent 3 coverage by wealth quintile
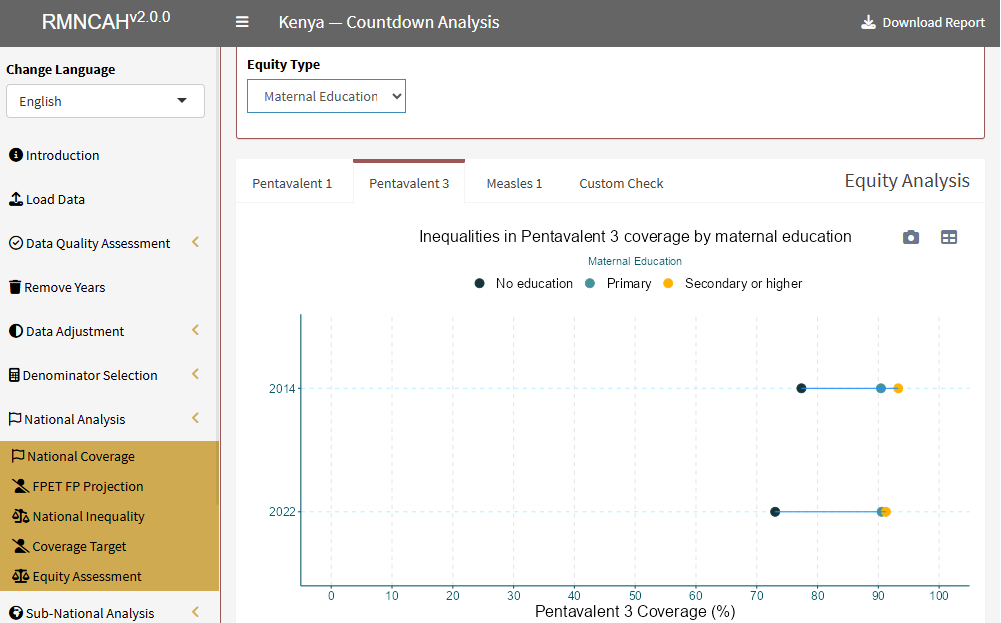 Equiplot of Pentavalent 3 coverage by maternal education
See also
- Rationale: equity analysis (equiplots)
- Glossary: Top inequality, Linear inequality, Bottom inequality
- Previous step: Bayesian modeling approach
- Next step: Subnational analysis