Subnational analysis
Subnational analysis asks how coverage varies between regions (Admin1) and districts (Admin2), whether geographic inequality is reducing, and how many units reach coverage targets. It produces subnational coverage estimates, the regional one-pager, the MADM inequality measure and the percentage of units meeting each target.
At a glance
- Answers: How does coverage vary across regions and districts? Have inequalities between subnational units reduced? What percentage of regions and districts meet each target?
- Uses: the same adjustment (Data adjustment) and the best-performing denominator (Denominator selection) as the national analysis (National coverage).
- Produces: coverage by region and district, the regional subnational statistical summary (one-pager) with the composite coverage index, the MADM, and the percentage of units meeting each target; used in the reports (Reports).
- In the apps: Sub-national analysis; national inequality and targets in Coverage, equity and targets.
- Defaults: Subnational
Why it matters
Subnational analysis reveals the geographic distribution of health service access—critical for identifying underperforming districts that drag down national averages and for targeting resources where they are most needed. This module estimates coverage at regional (Admin1) and district (Admin2) levels using the same denominator and adjustment methodology as national analysis, then visualizes how coverage varies across geography. Expect more volatility at district level due to small populations, referral patterns, and facility location choices (hospitals in towns serve surrounding rural areas), but this noise contains actionable intelligence about where health systems fail.
DataSuite generates district-level “one-pagers”—visual summaries pairing facility-based trend lines (2020–2024) alongside recent survey snapshots, comparison bar graphs showing each district’s performance relative to peers, and composite coverage indices averaging seven mother-and-child-health indicators. These one-pagers communicate coverage reality to decision-makers in accessible, locally-contextualized formats, making it impossible to ignore geographic inequities and facilitating evidence-based allocation of health system strengthening investments.
Subnational coverage
Subnational analysis of health intervention coverage is essential for advancing universal health coverage (UHC), which aims to ensure equitable access to quality health services for all populations. National averages often mask critical disparities that exist across regions, districts, or population subgroups.
National averages hide the regions and districts that are being left behind, and regions and districts are where programme action is usually targeted. Monitoring subnational data helps identify geographical areas where coverage is low, signaling potential inequities in health service access and prompting targeted interventions. This is particularly important for drawing attention to populations who are left behind and ensuring resources are directed where they are most needed.
Inequality and global coverage targets
Reducing geographic inequality is essential for equitable health systems and achieving the SDGs. Subnational inequalities reveal inconsistencies in service delivery and highlight systemic barriers to healthcare access. Tracking inequality indicators helps assess whether health systems are becoming more equitable and whether targeted interventions are working.
Method
Subnational coverage
Coverage estimates at Admin1 and Admin2
The focus here is to assess the coverage estimates (e.g., ANC4, institutional deliveries, Penta3) at Admin1 and Admin2 levels using the best performing denominator for the coverage computations, as decided from the analysis in section 2 on denominators.
There will be more “noise” in the subnational data with improbably high or low coverage rates, compared to the national analyses, and more so in the district analyses than in the regional (Admin1) analyses. This is because district analyses are affected by small numbers (more fluctuations which may be random or due to data quality issues) and by the health service utilization patterns by women and children. For instance, a municipal district may get more deliveries than an adjacent rural district because of the location of the hospitals in the municipal district. Small numbers, patient movement between districts and reporting gaps all produce implausibly high or low values.
Subnational statistical summaries (one-pager)
The aim is to produce a one-pager for each Admin1 unit (generally region, province or county) that contains the regional information as well as a summary of the districts within the region. We refer to this as the regional subnational statistical summary.
The following components are included:
- Summary of key demographic information for the region and the districts: A table with the expected number of births in 2024 according to the DHIS2 projections and according to the preferred denominators derived from the health facility data (based on ANC1 for live births, and on penta1 for immunization indicators).
- Line graphs with the trend in coverage of institutional deliveries and penta3 vaccination: These include the best estimates for 2020–2024 based on the health facility data, as well as the estimates from the most recent surveys (from 2015) for the same indicators (with confidence intervals if possible).
- Bar graphs that compare the 2024 coverage situation in the region compared to all other regions: This puts the region into the lowest, middle, or upper third of regions in terms of coverage. This is done for both institutional deliveries and penta3 vaccination.
- Table that summarizes the coverage for institutional deliveries and penta3 vaccination in 2024 by district: A localized breakdown of performance across the subnational area.
Other indicators can be used as prioritized by the country (e.g., ANC4, measles1).
Template layout of the regional subnational statistical summary one-pager:
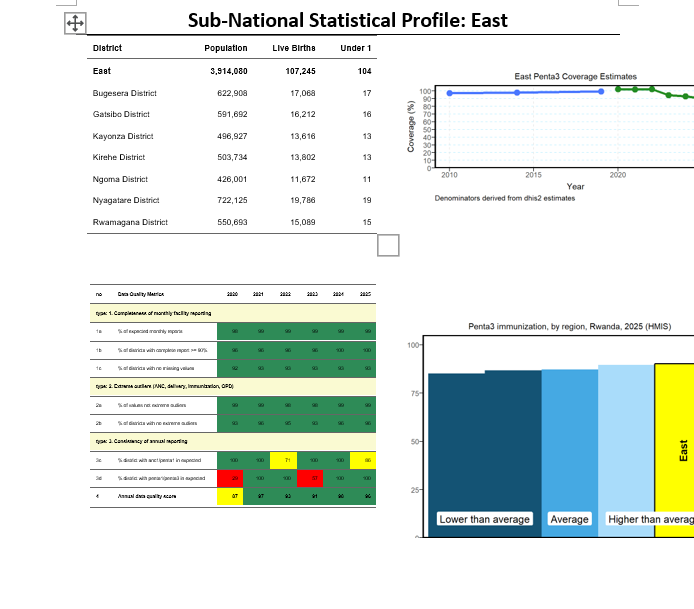 Template of the regional subnational statistical summary one-pager
To summarize the coverage situation according to the health facility statistics for 2024 can be done for the regional level and shown on a map. A composite coverage index is computed as an average in seven mother and child health indicators: ANC4, institutional live birth coverage, SBA, IPT2, postnatal care, pentavalent vaccine 3rd dosage and measles 1 vaccination coverage. Equal weight is given to all indicators.
Inequality
MADM and units above a target
Here we calculate the Median Absolute Deviation from the Median (MADM) to quantify the spread in coverage among districts within an Admin1 level, compared with the coverage at that specific Admin1 subnational unit.
The key statistical measures for subnational inequalities are:
- MADM (Median Absolute Deviation from the Median): This measure gives an indication of whether the country has been successful in reducing inequalities between subnational units.
- Percent of subnational units with coverage above a specific target or threshold: This indicator provides information on the extent to which a country has been successful in reaching universal coverage at the subnational level.
Global coverage targets
Progress towards targets
Summary of district and regional performance:
Progress towards international and national targets can be measured by computing the percentage of regions and districts that have achieved these targets. The goal is for all regions and districts to have met the target. Higher percentages mean less (geographic) inequality.
Target values
The 2024 Countdown vaccination guidebook uses these targets:
| Indicator | Target | Source |
|---|---|---|
| Institutional delivery | 80% of districts with coverage of at least 80% | EPMM / ENAP |
| Routine immunization | 90% coverage for all routine vaccines | IA2030 |
| DTP3 (Penta-3) | Geographic equity: coverage in the 20% of districts with the lowest coverage | IA2030 |
| DTP3 (Penta-3) | At least 80% in every district |
The apps count a unit as meeting the target when:
| Indicator | Unit meets the target when |
|---|---|
| BCG, Penta-3, Measles-1 | Coverage is at least 90% (national) or at least 80% (region or district) |
| ANC-4 | Coverage is at least 70% |
| Institutional live births | Coverage is at least 80% |
| Dropout Penta-1 to Penta-3, Penta-3 to Measles-1 | Dropout is below 10% |
The apps report the percentage of units meeting each target. A target such as “Penta-3 at least 80% in every district” is met when that percentage reaches 100%. The geographic equity measure (Penta-3 coverage in the 20% of districts with the lowest coverage) is not computed by the apps.
RMNCAH and vaccine analyses differ here: the ANC-4 and institutional live births targets apply to RMNCAH analyses and the dropout targets to vaccine analyses; the vaccine targets apply to both. The Coverage Target page has the tabs ANC 4 Visits, Institutional Live Births and Vaccine in the RMNCAH app, and Vaccine and Dropout in the Vaxx app. See RMNCAH and vaccine analyses.
Interpretation
Subnational coverage
Check a map’s legend before you use it. The guidebook: if the legend shows only a few percentage points between the gradings, small differences look large; do not use the map.
- Compare the region with the national line. A survey point far from the DHIS2 line in one region often signals a denominator or reporting problem there. Check the reporting rate of the region (Data quality) before drawing conclusions.
District denominators are the least reliable. A district with coverage over 100 percent, or one that flips between years, is more likely to have a population or reporting problem than a real change. Cross-check it against the district’s data quality.
Inequality
In the inequality charts each dot is a subnational unit and the line is the national (or regional) coverage.
- A wide spread of dots means high inequality: the national average hides weak areas.
- A spread that narrows over the years means inequality is falling. The MADM summarises this spread.
- A district that is always low is different from one that is low only in a bad year: the second case may be a data problem.
- Facility inequality between regions can come from denominator or reporting differences, not real differences in access.
Global coverage targets
- A rising percentage of units meeting the target is good news only if coverage does not exceed plausible levels. Check units far above 100 percent for denominator problems.
- For dropout, remember that lower is better.
Common pitfalls
- Reading a single district year in isolation. Look at the trend and the neighbouring years.
- Small districts give noisy percentages. Read several years, not one.
- Comparing regions that have very different populations without checking numerators.
- Comparing Admin 1 and Admin 2 results directly: units differ in size and reliability.
- Forgetting that the denominator selected for the whole country also drives regional results. If one region looks impossible (above 100%), test another denominator before flagging the region.
- Ranking areas on the latest year only. Combine level, change over time, reporting completeness and denominator quality, as in National coverage > Best and worst subnational performance.
In the apps
The Sub-National Analysis group has three pages; Sub-national analysis has the screen-by-screen guide. National inequality and national targets are in Coverage, equity and targets. In the Vaxx app the indicator tabs and Custom Check cover the vaccination indicators.
Sub-National Coverage
Navigate to the Sub-National Analysis tab -> Sub-National Coverage and select the admin level of interest (Region (Admin Level1) or District). Then select the indicator of interest from the key indicators (ANC4, Institutional deliveries, Low Birth Weight, Penta 1 and Measles 1). You can also use the Custom Check tab to select any other indicator of interest.
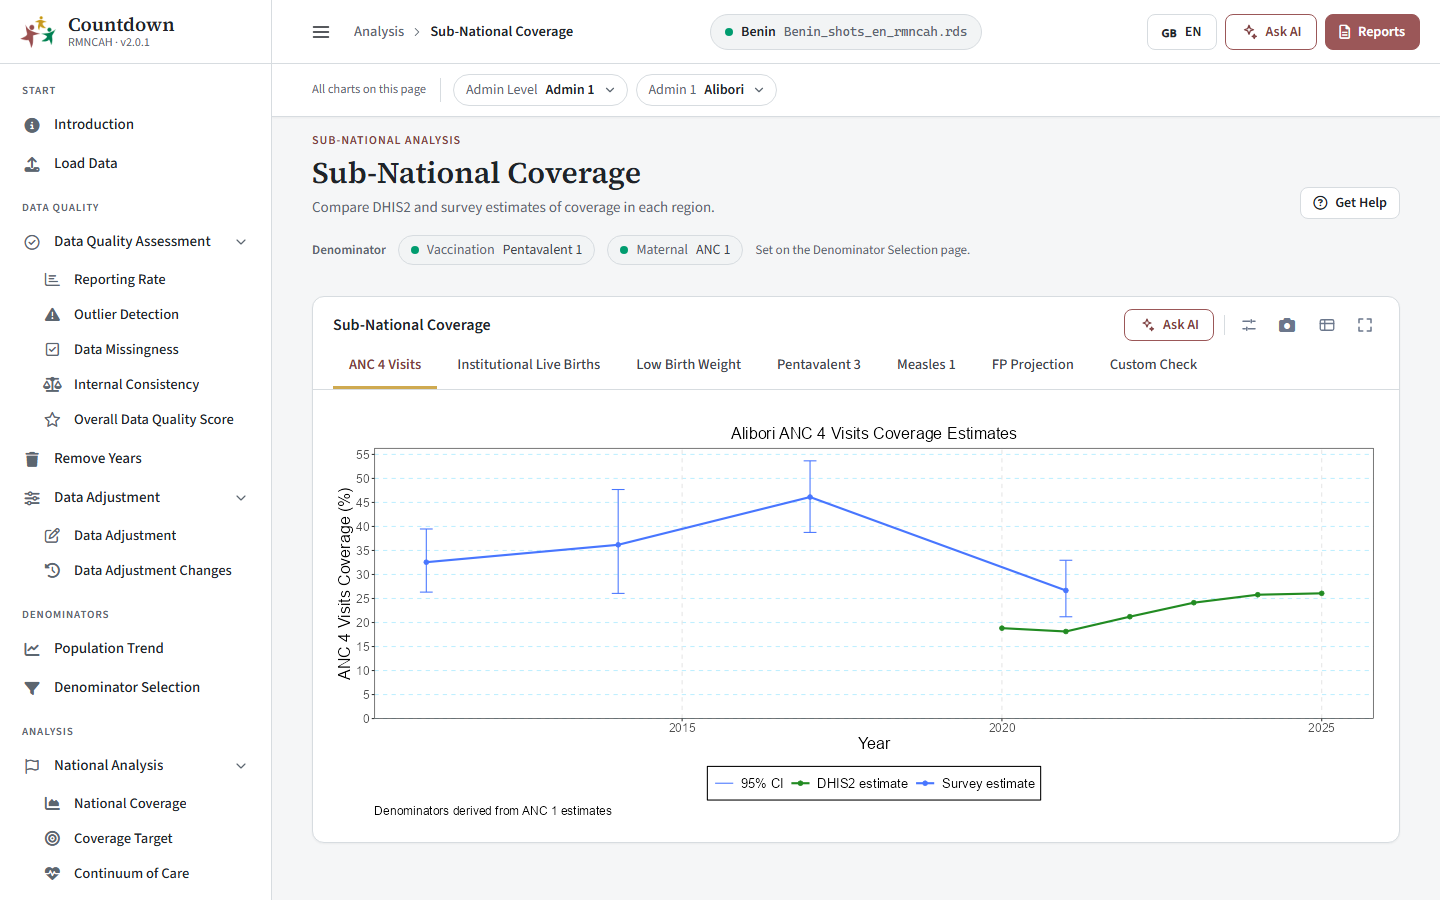 Subnational coverage tab showing institutional live births coverage estimates over time
Sub-National Inequality
Navigate to the Sub-National Analysis tab -> Sub-National Inequality and inspect the plotted regional and district results by year, with the median absolute deviation from the median (MADM), as the summary measure to assess if inequalities have reduced.
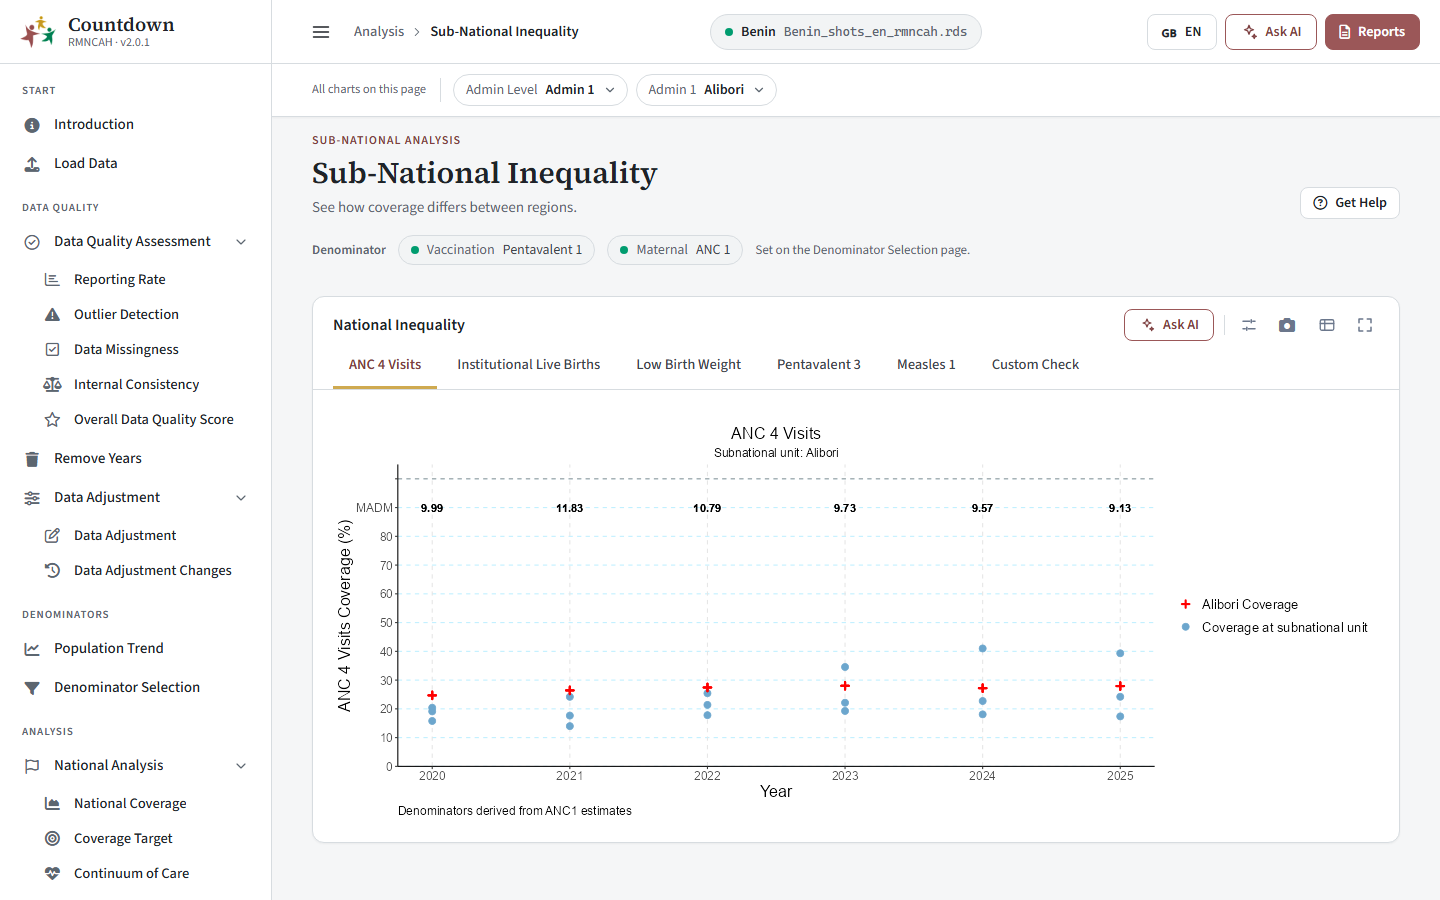 Subnational inequality tab showing the MADM by year for institutional live births
Coverage Target
Navigate to the Sub-National Analysis tab -> Coverage Target and read the percentage of districts in a region meeting each target, by year. The table lists the districts meeting the target for the indicator and year you select.
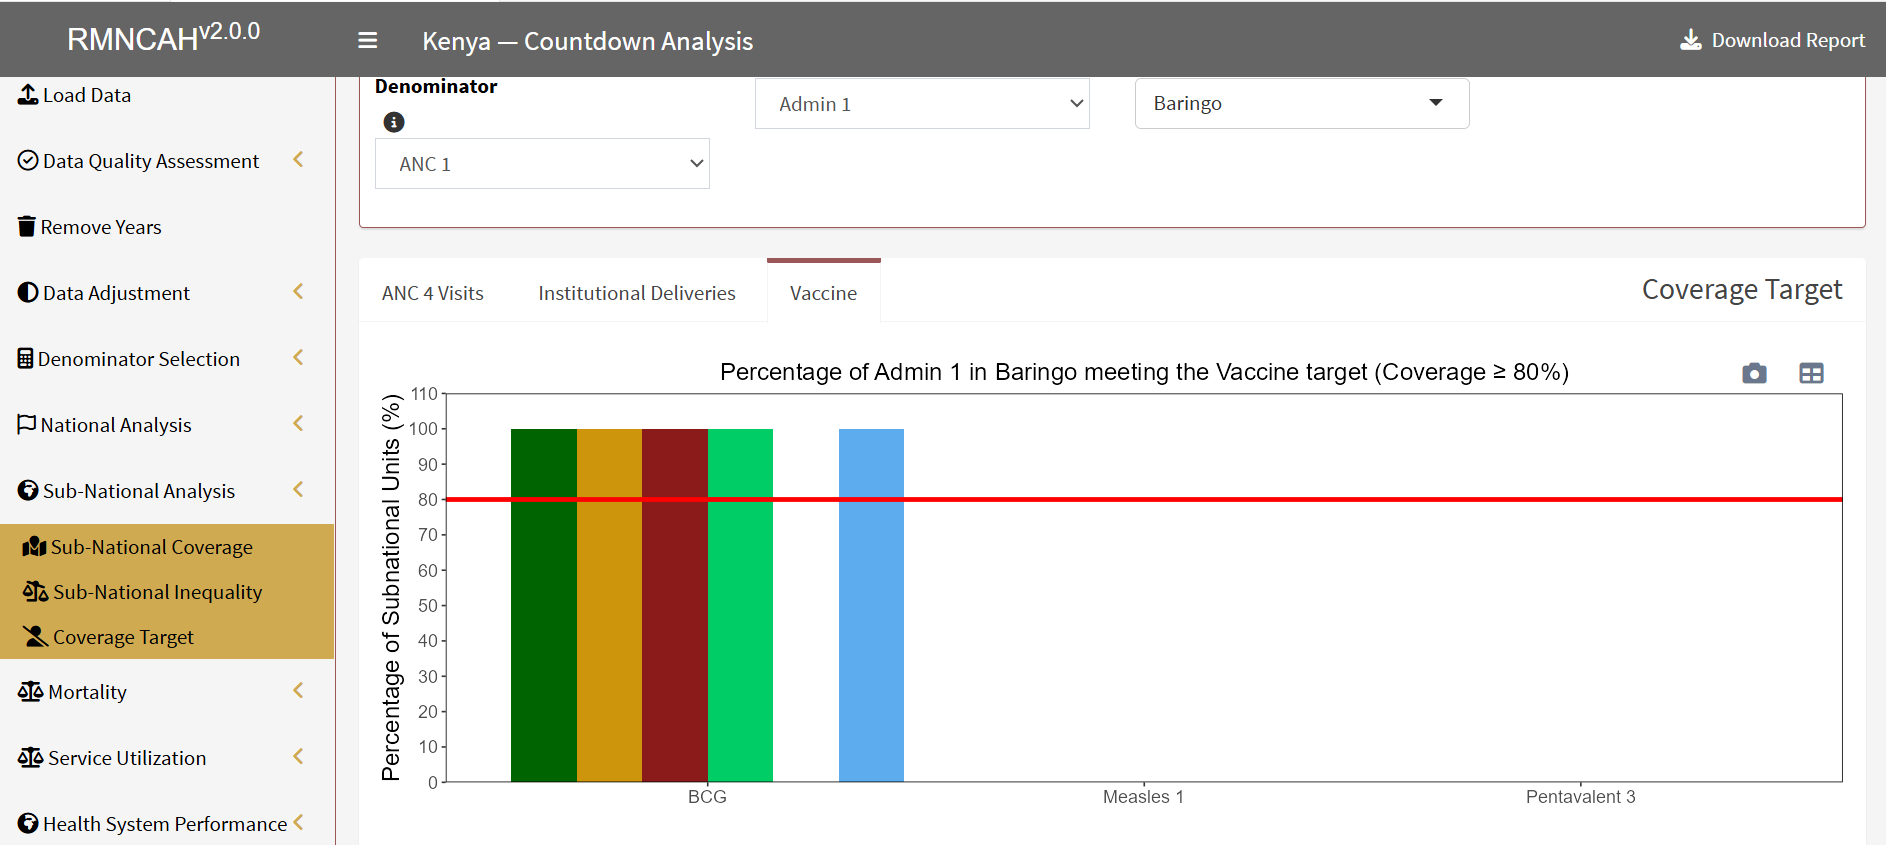 Coverage target tab showing the percentage of subnational units meeting the vaccine target
See also
- Formulas: subnational
- Defaults and thresholds: subnational
- Glossary: MADM, Percent of subnational units above a target or threshold
- The national analysis this step repeats: National coverage
- Previous step: Equity assessment (equiplots); next step: Mortality