Data quality assessment
This module systematically evaluates health facility data by considering the standard data quality metrics, which include:
- Reporting completeness
- Outlier detection
- Internal consistency
- Data missingness
- Ratio calculations
- Overall quality score
At a glance
- Answers: How complete, plausible and internally consistent are the health facility data, before coverage is estimated?
- Uses: the monthly health facility data (reports received and service numbers) and, for the expected ratios, the ANC1, Penta1 and Penta3 (and OPV1, OPV3) coverage from the most recent survey.
- Produces: the metrics 1a-1c, 2a-2b and 3a-3h and the overall quality score; missing values and extreme outliers are then corrected, and unreliable years can be removed, in Data adjustment.
- In the apps: Data quality (Data quality in the RMNCAH app, Data Quality Assessment in the Vaxx app).
- Defaults: Defaults and thresholds: data quality
Why it matters
High-quality health facility data form the foundation of reliable coverage estimates. For the scientific basis of each metric, see Data quality assessment: rationale.
Method
Reporting completeness
For further reading on the scientific basis and methods used to assess reporting completeness, go to Reporting completeness: rationale.
| Metric | Numerator | Denominator | Interpretation |
|---|---|---|---|
| 1a | Number of monthly facility reports received | Total expected reports (12 × number of facilities) | ≥90% is good; affects trend interpretation |
| 1b | Districts with ≥90% reporting completeness | Total districts | Identifies low-performing districts |
| 1c | Districts with no missing values across all forms | Total districts | Identifies the distribution of missing values across districts |
RMNCAH and vaccine analyses differ here: statistics for 1a and 1b are the mean over the analysis’s reporting forms: RMNCAH analyses use ANC, delivery, immunization and OPD (inpatient excluded); vaccine analyses use ANC, delivery and immunization. The 2024 Countdown vaccination guidebook based them on the immunization form only. See RMNCAH and vaccine analyses.
Outlier detection
An extreme outlier is defined as a monthly value more than 5 times the median absolute deviation (MAD) away from the median monthly value of the same series (Hampel method) — the district’s, or the national or admin-1 series being assessed. The median and MAD are computed from all years except the most recent one, so the latest year is judged against the earlier years. For further reading on the scientific basis and methods used to assess and adjust for extreme outliers, go to Extreme outliers: rationale.
| Metric | Numerator | Denominator | Interpretation |
|---|---|---|---|
| 2a | Monthly values not classified as outliers | Total monthly values | ≥99% expected |
| 2b | Districts with no outliers | Total districts | ≥90% expected |
Internal consistency
- Internal consistency assesses the degree to which related indicators are aligned within the dataset, based on expected epidemiological and service delivery relationships.
- Within the CD2030 analytical framework, this step complements other DQA metrics by evaluating whether indicators that are biologically or programmatically linked follow plausible patterns.
- Unlike standalone indicator checks, internal consistency focuses on relationships between indicators, ensuring that reported values reflect realistic service delivery pathways across the continuum of care.
The following metrics are considered when assessing internal consistency:
National ratios:
| Metric | Numerator | Denominator | Interpretation |
|---|---|---|---|
| 3a | ANC1 reported (national) | Penta1 reported | Expected ratio 1.07 × (ANC1 ÷ Penta1 survey coverage), ± 0.05 (see Ratio calculations) |
| 3b | Penta1 reported (national) | Penta3 reported | Expected ratio Penta1 ÷ Penta3 survey coverage, ± 0.05 |
| 3c (vaccine analyses) | OPV1 reported (national) | OPV3 reported | Expected ratio OPV1 ÷ OPV3 survey coverage, ± 0.05 |
District ratios: the share of districts whose ratio is between 1.0 and 1.5 (a wider range, as district ratios vary more):
| Ratio | RMNCAH analyses | Vaccine analyses | Numerator | Denominator |
|---|---|---|---|---|
| ANC1 / Penta1 | 3c | 3f | Districts with the ratio between 1.0 and 1.5 | Total districts |
| Penta1 / Penta3 | 3d | 3g | Districts with the ratio between 1.0 and 1.5 | Total districts |
| OPV1 / OPV3 | – | 3h | Districts with the ratio between 1.0 and 1.5 | Total districts |
RMNCAH and vaccine analyses differ here: vaccine analyses add the OPV1/OPV3 ratio (3c nationally, 3h for districts), so the district checks are 3c and 3d in RMNCAH analyses and 3f, 3g and 3h in vaccine analyses. The Vaxx app’s Internal Consistency page also plots IPV1 against IPV2, which is not scored. See RMNCAH and vaccine analyses.
Data missingness
- Missing monthly values are measured by 1c: the share of districts with no missing monthly values in a year for any reporting form (see Reporting completeness).
- In the data adjustment step, a missing monthly value is replaced with the district’s median monthly value for the year.
Ratio calculations
- ANC1 to Penta1 (3a). Between the first antenatal visit (around 20 weeks of pregnancy) and Penta1 (6-8 weeks after birth), the method assumes a pregnancy loss of 3%, a stillbirth rate of 2%, a twinning rate of 1.5% and neonatal mortality before Penta1 of 3%. With the same survey coverage for ANC1 and Penta1, this gives an expected ANC1 to Penta1 ratio of 1.07; in general the expected ratio is 1.07 × (ANC1 coverage ÷ Penta1 coverage), both from the most recent survey.
- Penta1 to Penta3 (3b). Mortality plays a small role between 6 and 14 weeks of age, so the expected ratio is set by the drop-out between the doses: Penta1 coverage ÷ Penta3 coverage in the latest survey (e.g. 0.95 ÷ 0.85 = 1.12). OPV1 to OPV3 (3c, vaccine analyses) is assessed the same way.
- Acceptable range. A national ratio within ± 0.05 of its expected value is acceptable; outside it, flag the ratio and discuss possible explanations. District ratios vary more: a ratio between 1.0 and 1.5 is considered within range.
Overall quality score
| Metric | Numerator | Denominator | Interpretation |
|---|---|---|---|
| Overall score | Computed automatically | Computed automatically | Mean of 1a, 1b, 1c, 2a, 2b and the district ratio checks (see below) |
RMNCAH and vaccine analyses differ here: the district ratio checks in the score are 3c, 3d in RMNCAH analyses and 3f, 3g, 3h in vaccine analyses. In vaccine analyses the score’s 1c is the mean over the tracer vaccines (BCG, Penta1-3, OPV1-3, Measles 1) and 2b the mean over the vaccines only; RMNCAH analyses take both over all the indicators. See RMNCAH and vaccine analyses.
The 2024 Countdown vaccination guidebook left 1c out of the score; the apps include it.
Interpretation
Reporting rates
A high national reporting rate can hide many low-reporting districts. Always check the district view and the score by region.
- Reporting rate measures whether reports arrived, not whether the numbers are right. Use outlier detection and internal consistency together.
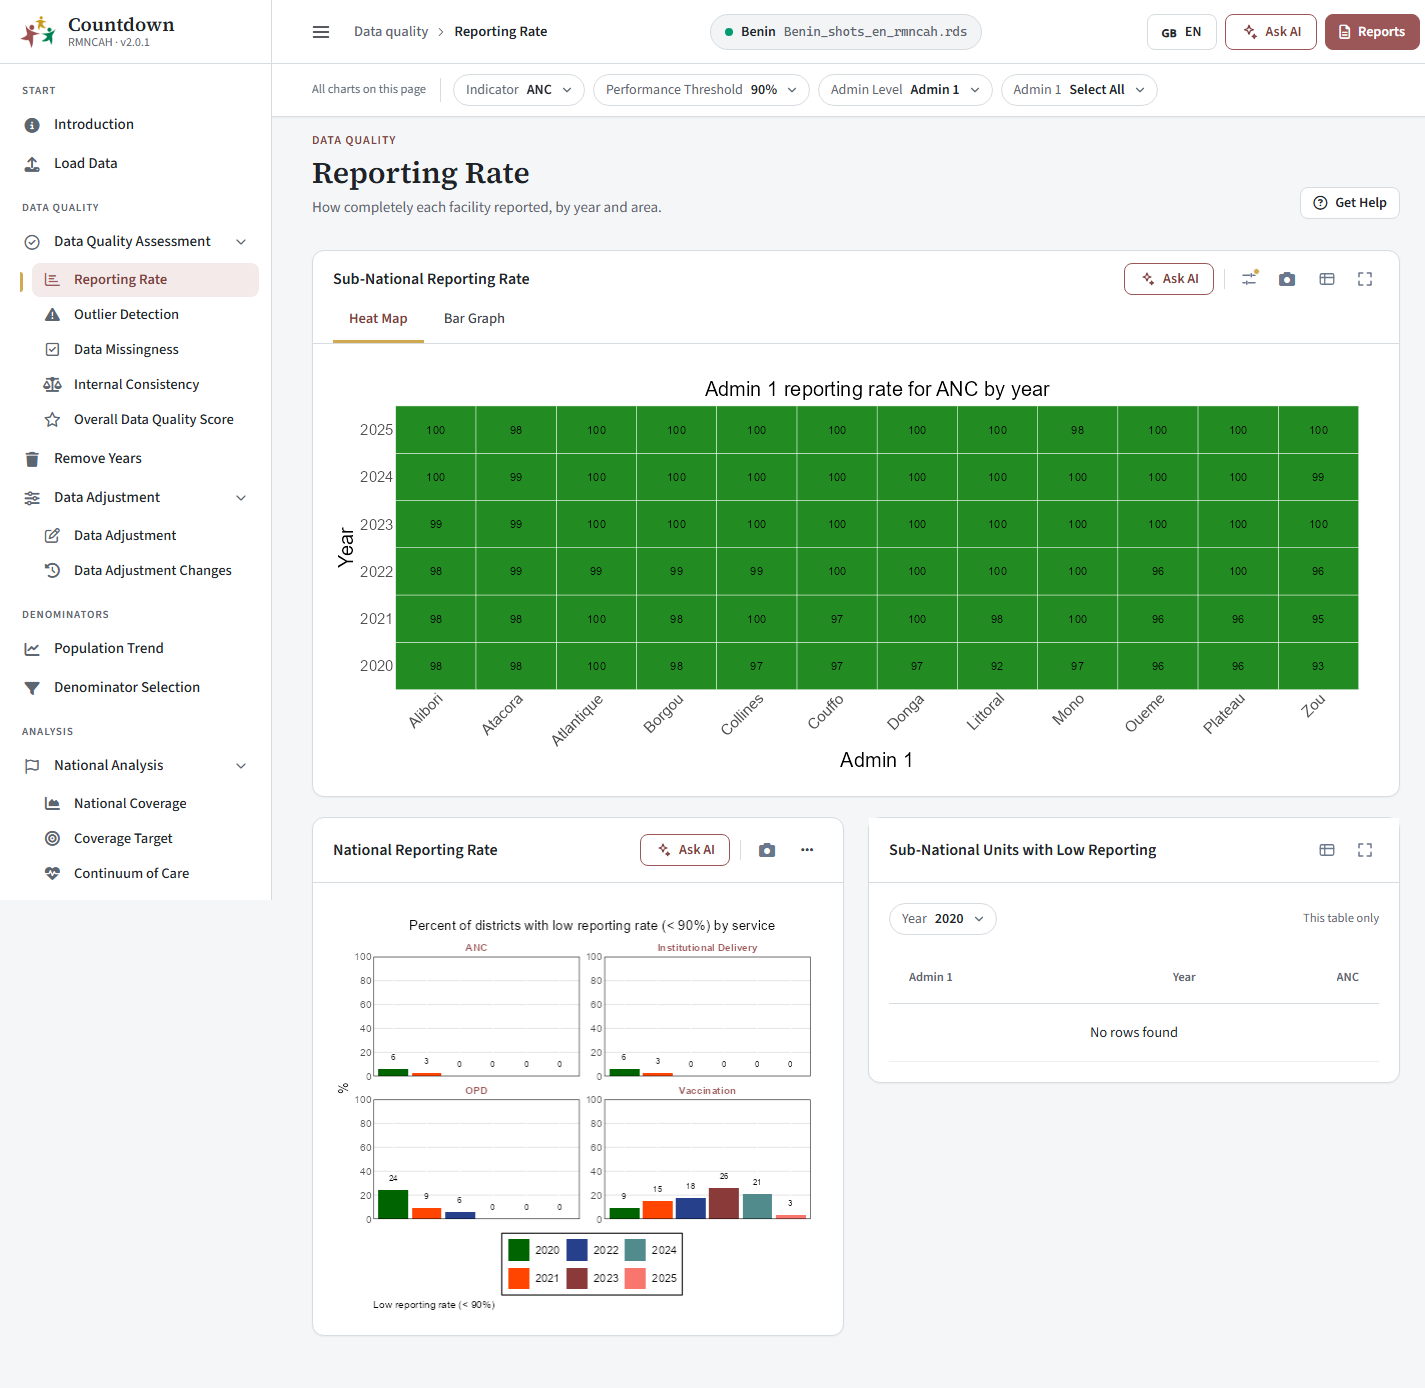 Sub-national reporting rate heat map
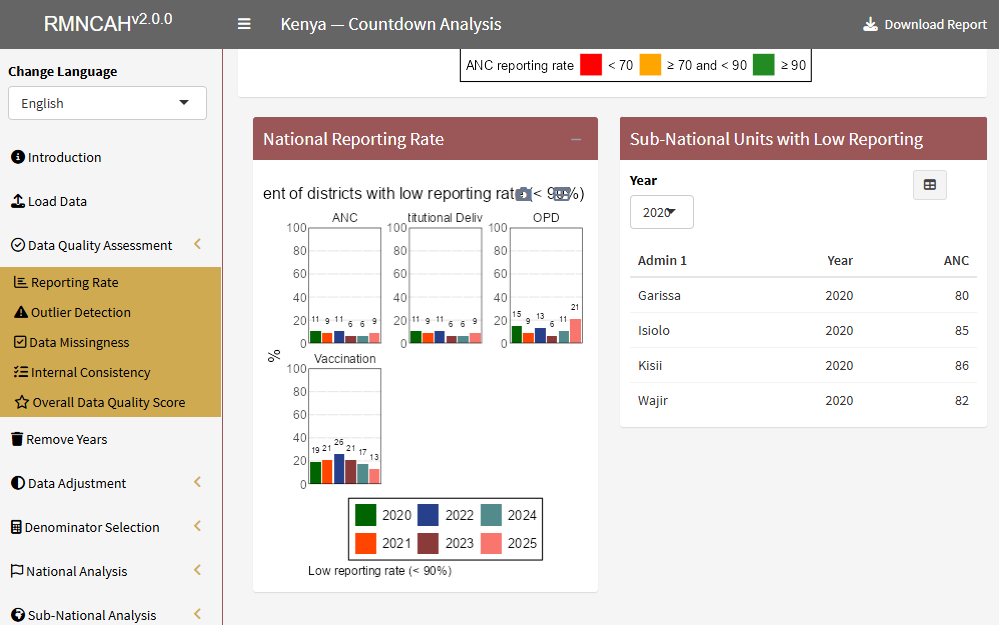 National reporting rate and sub-national units with low reporting
Outliers
Outliers are identified statistically. Always assess whether deviations reflect real-world events (e.g., campaigns) or data errors.
- Expect at least 99% of monthly values (2a), and 90% of districts (2b), to be free of extreme outliers.
- A sudden peak may be a campaign, not an error. Check the trend before you decide.
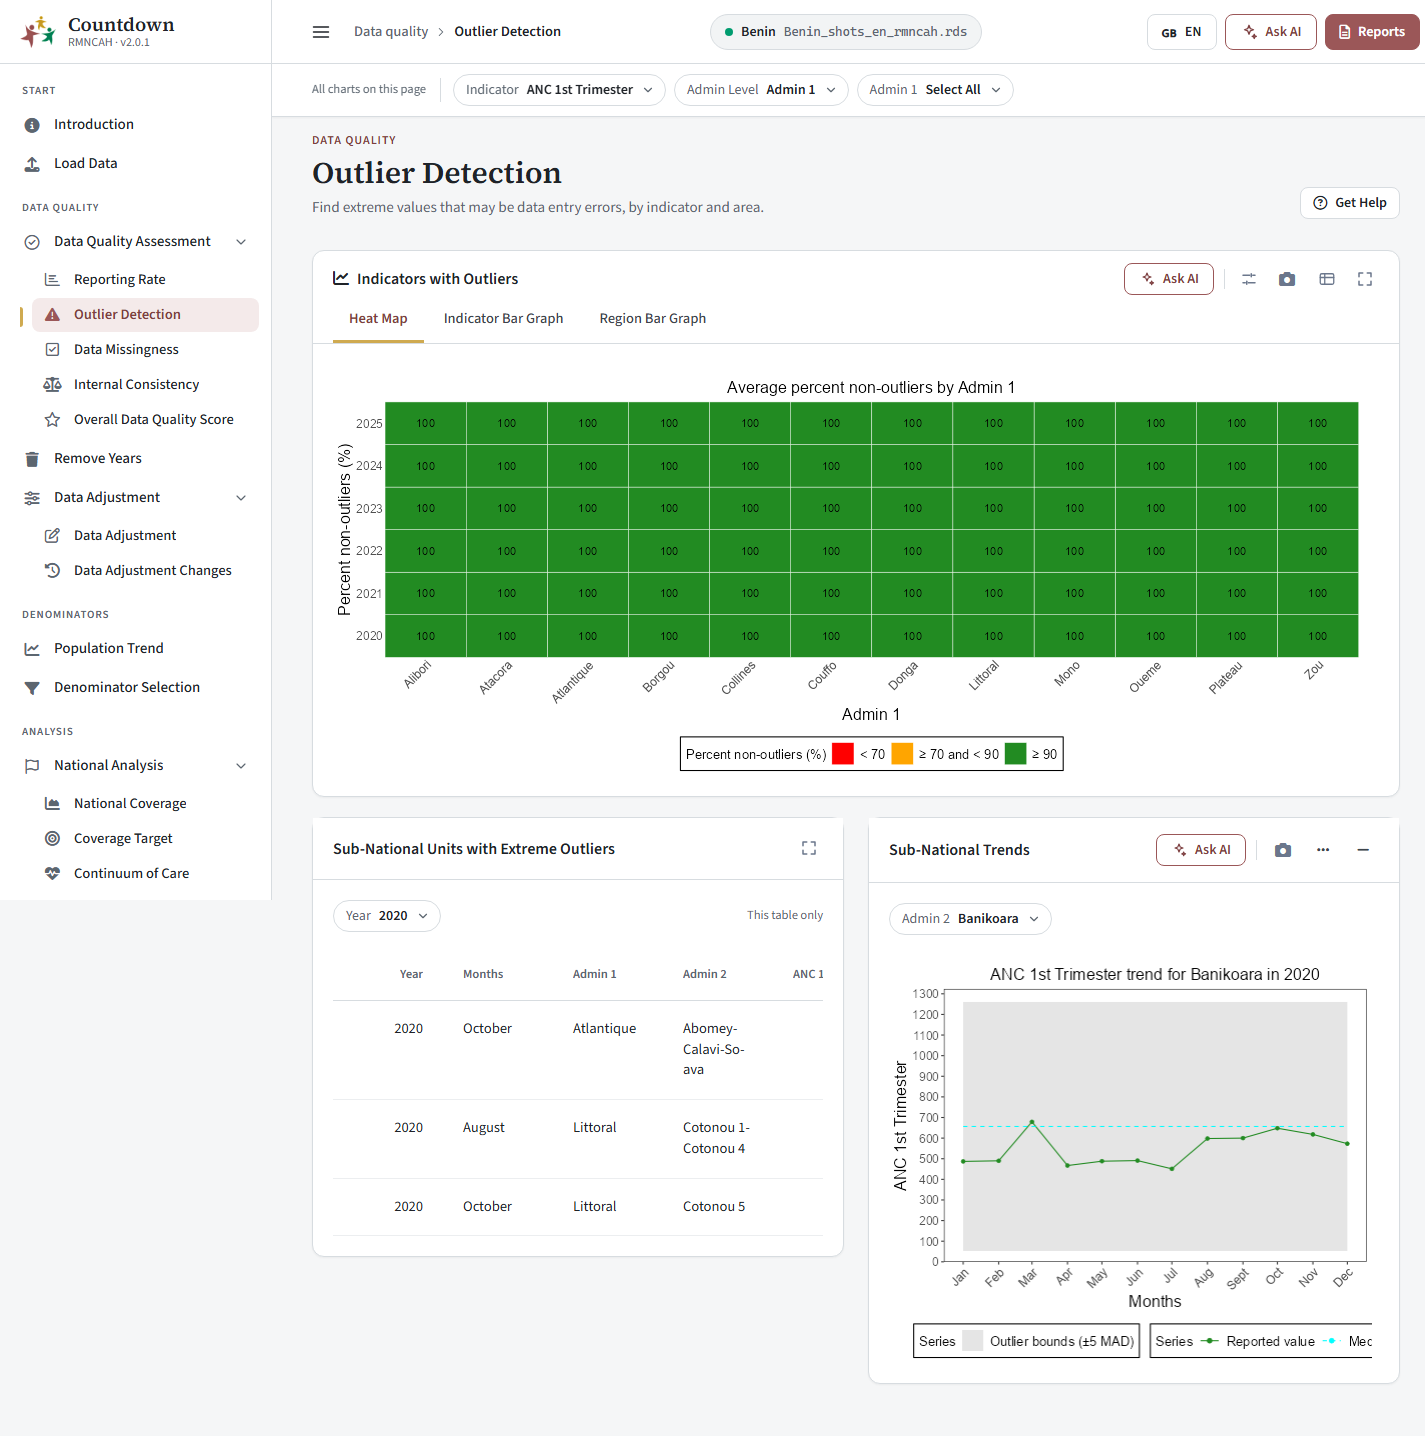 Outlier detection heat map by region and year
Consistency and ratios
- Reflect on large differences between years (e.g. more than 0.10).
- In a consistency check, points far from the diagonal indicate inconsistent reporting and deserve a look.
- Consistency plots show plausibility, not truth: an unusual Penta1/Penta3 ratio can be a real dropout problem or a data problem.
- The expected ratios come from the survey coverage values, so wrong survey values distort this check.
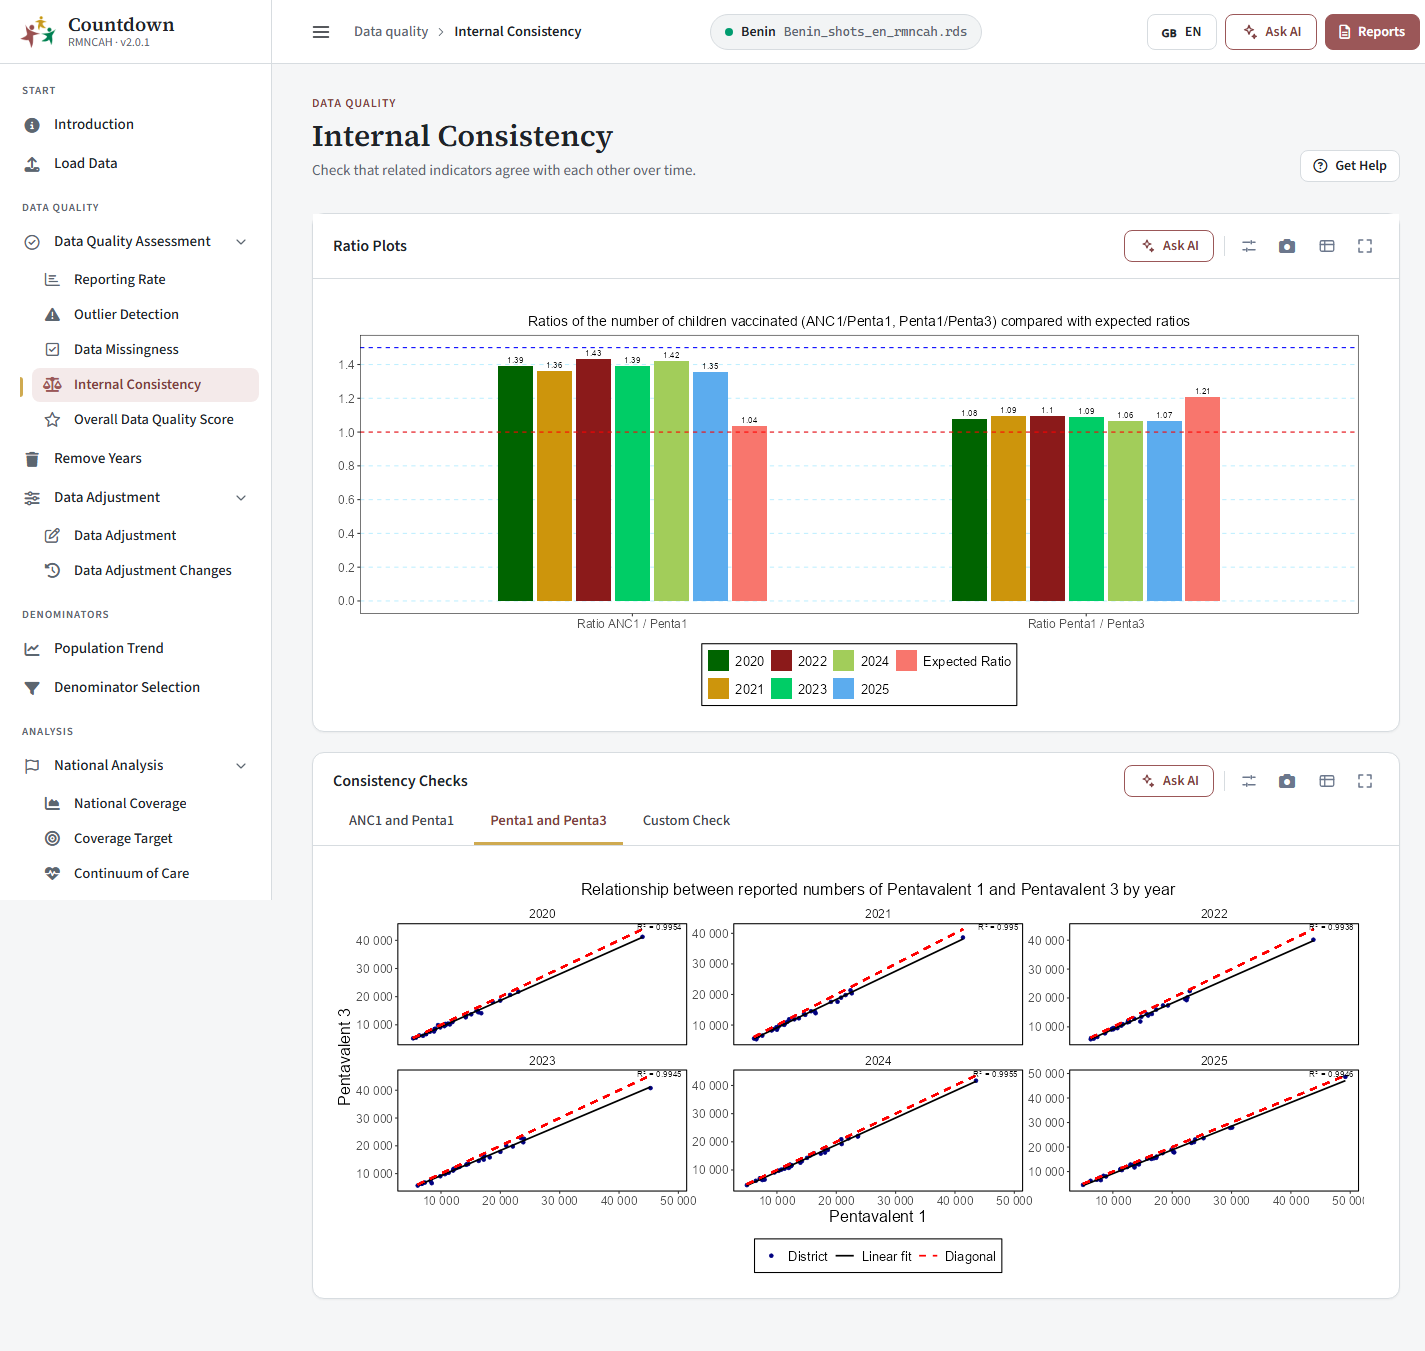 Consistency checks between ANC1 and Penta1 by year
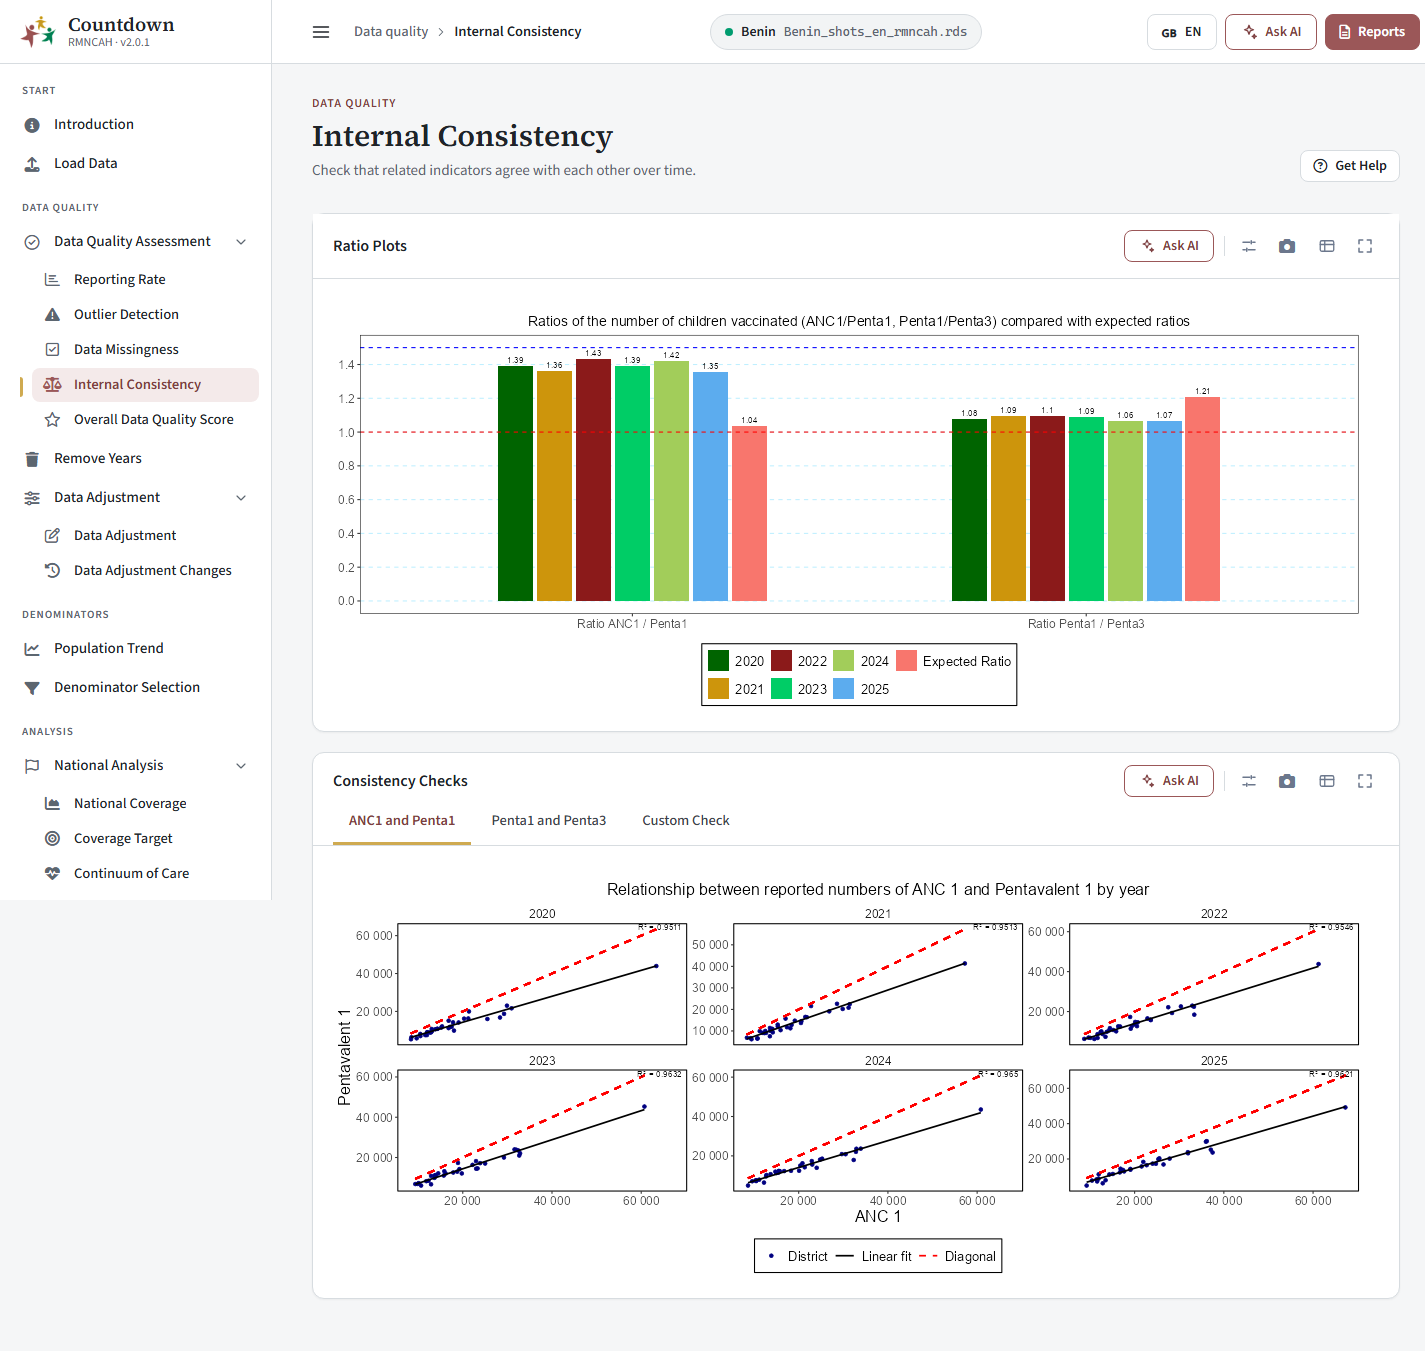 Ratio plots of ANC1/Penta1 and Penta1/Penta3 by year
Missing values
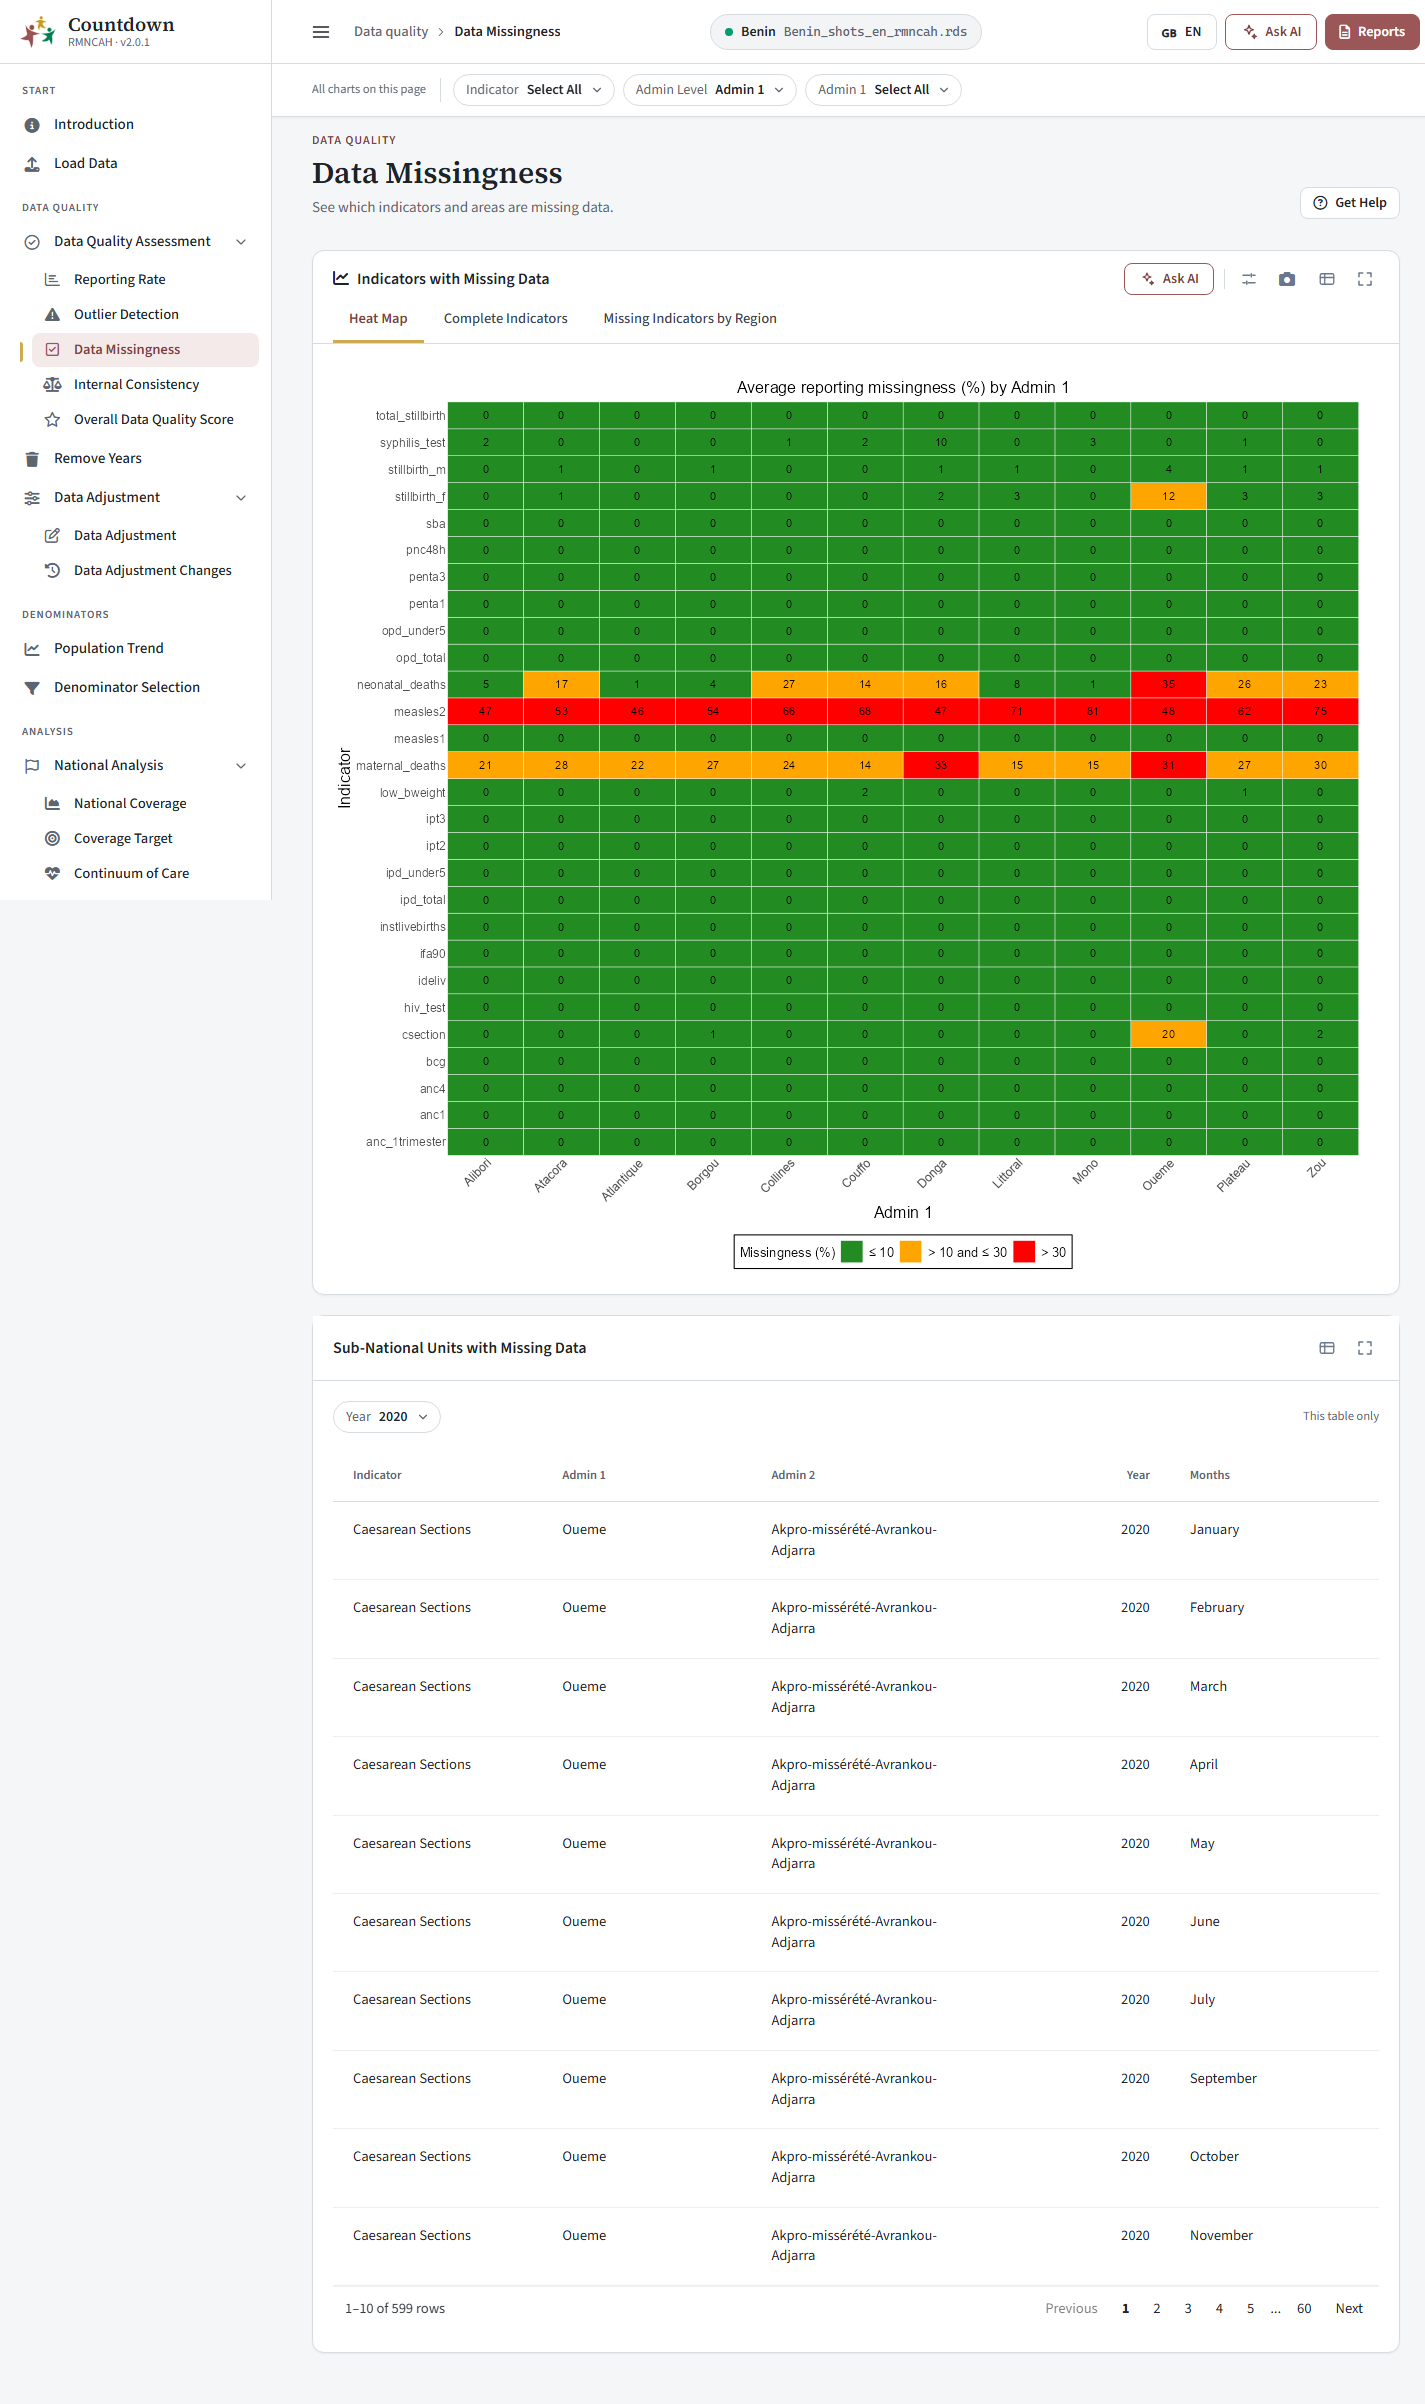 Data missingness heat map by indicator and region
Overall score
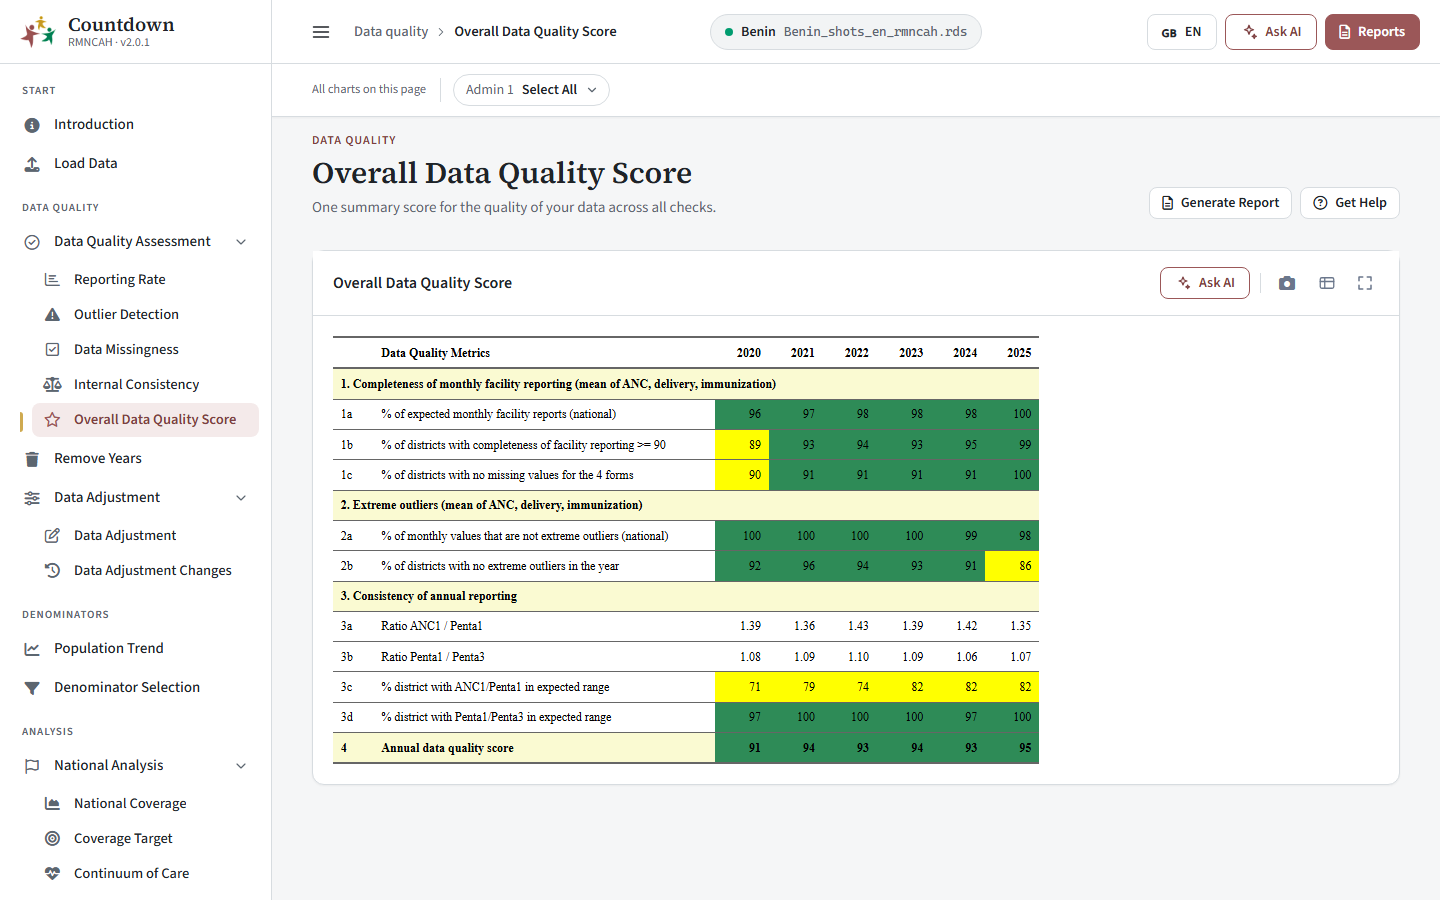 Overall data quality score table by year
Common pitfalls
- A low score is a reason to investigate, not always to discard a year. Compare with local events before using Remove Years. A year with many outliers or low completeness is a candidate for Remove Years or careful adjustment (see Data adjustment).
- District results are noisier than regional ones because they rest on smaller numbers.
- Changing the performance threshold changes the score, so agree it with your team before comparing years or countries.
In the apps
Open the data quality pages
They are under Data quality in the RMNCAH app and Data Quality Assessment in the Vaxx app: see Data quality for each page and its filters.
Review the metrics
Work through Reporting Rate, Outlier Detection, Data Missingness, Internal Consistency and the Overall Data Quality Score.
DataSuite automatically computes the overall data quality score.
Continue to data preparation
Remove unreliable years and adjust the data in Data preparation.