Denominator assessment and selection
This section on denominator selection helps you select the most appropriate approach for denominator estimation for the computation of the coverage indicators at the national and subnational levels. For more information, please refer to the guidebook on the Countdown DataSuite.
At a glance
- Answers: Which denominator option gives the most plausible coverage, compared with the survey, at national and subnational level?
- Uses: the adjusted numbers from Data adjustment, the UN and DHIS2 population projections, and the survey values (ANC-1 and Penta-1 coverage, stillbirth rate, NMR, PNMR) from Analysis setup.
- Produces: the selected denominator(s) (one or two, depending on the analysis: see Selecting the best denominator option), used for the coverage indicators in Coverage.
- In the apps: Denominators (Denominator Assessment and Denominator Selection).
- Defaults: Defaults and thresholds: denominators
Why it matters
The numerators of coverage statistics (e.g., number of live births in health facilities) are derived from the health facility data and need to be adjusted as shown in the previous section. The denominator of the coverage statistics (e.g., number of live births in the population) needs to be estimated for national and subnational levels (regions/provinces and districts). Because the numerator comes from facility data and the denominator has to be estimated, the choice of denominator matters as much as the data quality.
For the scientific basis of facility-based coverage and its denominators, see Coverage analysis: rationale.
Method
Service coverage
Service coverage is defined as the population who received the service divided by the population who need the services (also referred to as the target population). In a vaccine analysis, it is the number of vaccinated children divided by a target population.
Denominator options
There are six denominator options that are analyzed to determine the most accurate baseline:
- The UN estimates of live births (UN projections)
- The DHIS2 projection of live births (DHIS2 projections)
- Derivation of denominators from ANC-1 services utilization (ANC-1 derived)
- Derivation of denominators from Penta-1 immunization (Penta-1 derived)
- Derivation of denominators from ANC-1 services utilization, with adjustment for annual population growth (ANC-1 population growth)
- Derivation of denominators from Penta-1 immunization, with adjustment for annual population growth (Penta-1 population growth)
UN projections are national only. The 2024 Countdown vaccination guidebook: “For the subnational level, no UN projections are available.” Below national level, compare the DHIS2 projections and the ANC-1 and Penta-1 derived options. In the apps, the UN projections appear in the national comparison; the denominators you can select are DHIS2, ANC-1, Penta-1, ANC-1 population growth and Penta-1 population growth.
Computing the derived denominators
The ANC-1 derived option starts from the number of women attending a first antenatal visit and works forward through pregnancy to the eligible infants; the Penta-1 derived option starts from the number of infants vaccinated with Penta-1 and works backward.
| Population | From ANC-1 | From Penta-1 |
|---|---|---|
| Pregnancies | ANC-1 ÷ survey ANC-1 coverage | deliveries ÷ (1 − pregnancy loss) |
| Deliveries | pregnancies × (1 − pregnancy loss) | births × (1 − 0.5 × twin rate) |
| Births | deliveries ÷ (1 − 0.5 × twin rate) | live births ÷ (1 − stillbirth rate) |
| Live births | births × (1 − stillbirth rate) | infants ÷ (1 − NMR) |
| Infants eligible for Penta (under 1) | live births × (1 − NMR) | Penta-1 ÷ survey Penta-1 coverage |
| Measles 1 target | infants × (1 − PNMR) | infants × (1 − PNMR) |
| Measles 2 target | infants × (1 − 2 × PNMR) | infants × (1 − 2 × PNMR) |
Each coverage indicator uses the population that matches it: pregnancies for ANC, deliveries for institutional deliveries, live births for institutional live births and BCG, infants for Penta, and the measles targets for measles. The DHIS2 and UN projections of live births are converted to the other populations with the same assumptions.
Default assumptions (guidebook):
| Assumption | Default |
|---|---|
| Pregnancy loss | 3% |
| Stillbirth rate | 2% |
| Twin rate | 1.5% |
| Neonatal mortality rate (NMR) | 3% |
| Post-neonatal mortality rate (PNMR) | 2.4% |
The apps use the country’s most recent survey values when they are available: ANC-1 and Penta-1 coverage (otherwise 98% and 97%), and the stillbirth rate, NMR and PNMR. When the survey gives no NMR, the apps use 2.5%, not the guidebook’s 3%. Pregnancy loss and the twin rate always use the defaults.
Selecting the best denominator option
The goal here is to identify the best denominator option for the computation of the coverage indicators. How many denominators you choose depends on the analysis.
RMNCAH and vaccine analyses differ here: a vaccine analysis uses one denominator for all the immunization indicators (the Vaxx app’s Vaccination denominator); an RMNCAH analysis uses two: a maternal denominator for the ANC and delivery indicators and an immunization denominator for the immunization indicators (the RMNCAH app’s Maternal denominator and Vaccination denominator). See RMNCAH and vaccine analyses.
To identify the best option, follow these steps: (1) the population trend comparison, below; then, under Interpretation, (2) the denominator selection examination and (3) the final selection and synthesis.
Population trend comparison
Under the “Population Trend” section, compare the trends in the total population, total live births, and under-1 population between the UN and the DHIS2 projections.
Select the indicator trends (total population, live births, or under-1 population) that are consistent across the two sources, with estimates generally close: the two sources are close and follow the same direction, with a stable, plausible gap between UN and DHIS2.
- Example: You may select the under-1 population if the UN estimates and the DHIS2 projections for that demographic are very close.
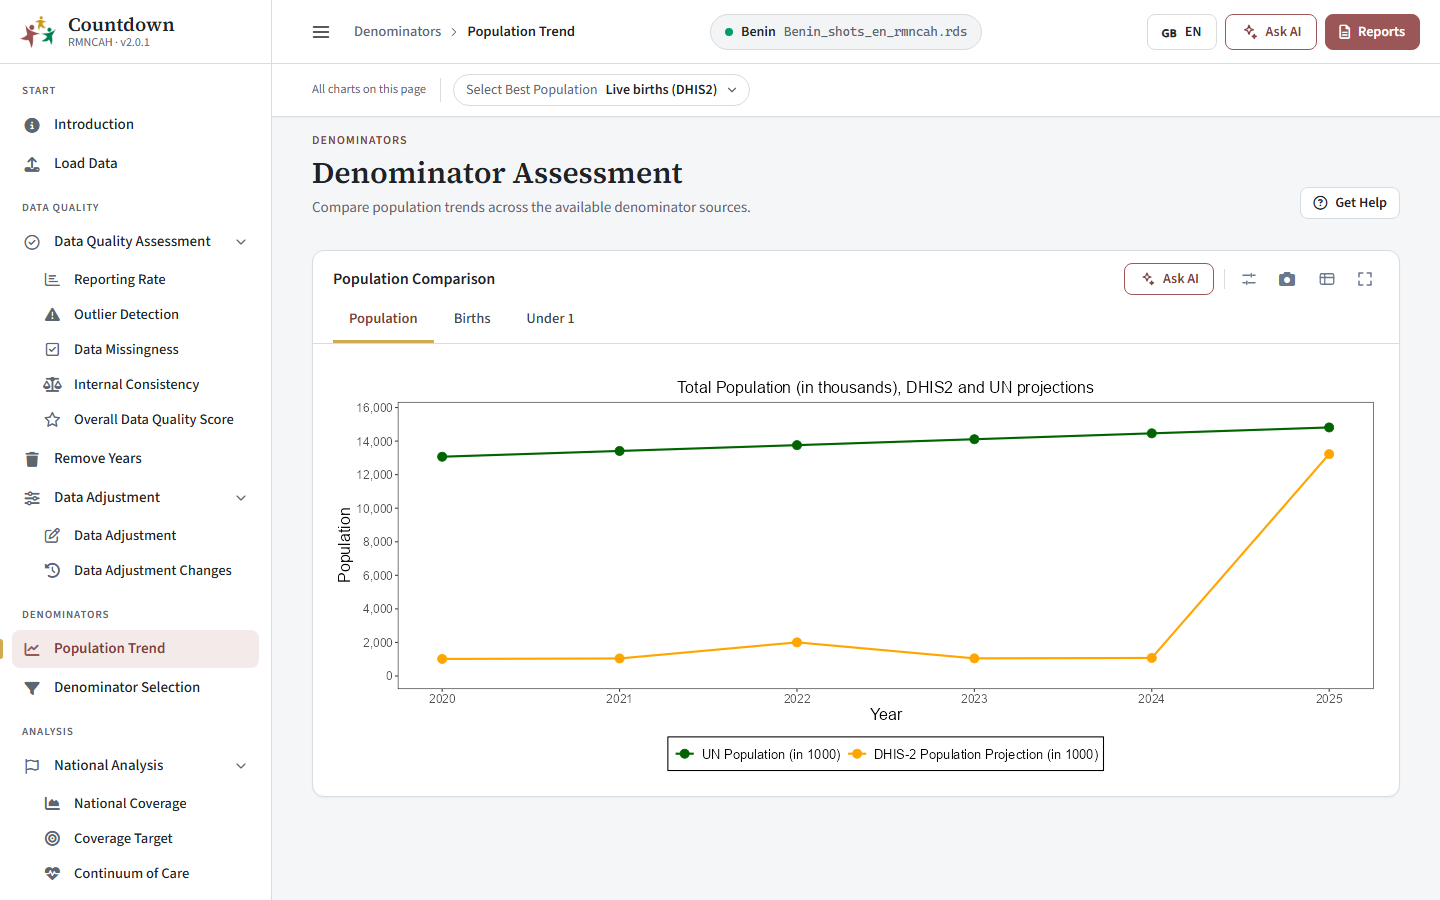 Population comparison between UN and DHIS2 projections
The indicator selected in this step sets the DHIS2 population the derived denominators are built from, and will be used to adjust the ANC-1-derived and Penta-1-derived options with population growth.
Check the quality of the DHIS2 projections. The guidebook flags a DHIS2 projection as inconsistent when:
- Over time: the population growth rate or the crude birth rate (CBR) changes by 2 per 1,000 or more between years.
- Against the UN projections: the population differs by more than 5% (relative difference), the growth rate by more than 0.3% (absolute difference), or the CBR by more than 5 per 1,000.
- Implied crude death rate: CDR = CBR − growth rate is negative or below 5 per 1,000.
The apps show the trends; these checks are made by the analyst.
Interpretation
Reading the population trends
- Large gaps between UN and DHIS2 suggest an outdated census base or a wrong population entry in the workbook.
- A sudden break in one line usually means a change in how the population was projected, not a real change in births.
- DHIS2 projections often drift when they are based on an old census.
Denominator selection examination
Under “Denominator Selection”, examine the consistency between the survey estimates and the computed estimate from DHIS2 data using each denominator method. This is done by comparing three sets of graphs at national and subnational levels:
a. Comparison of national estimates: First, compare the national estimate of each indicator between the routine data and the survey data by examining the first bar graph for the survey year. The figure shows a horizontal dotted line indicating the survey estimate and a bar corresponding to the routine estimate. A denominator that gives coverage close to the survey, without exceeding 100 percent, is a good candidate. In making this comparison, note down the best denominator options (there may be more than one viable option).
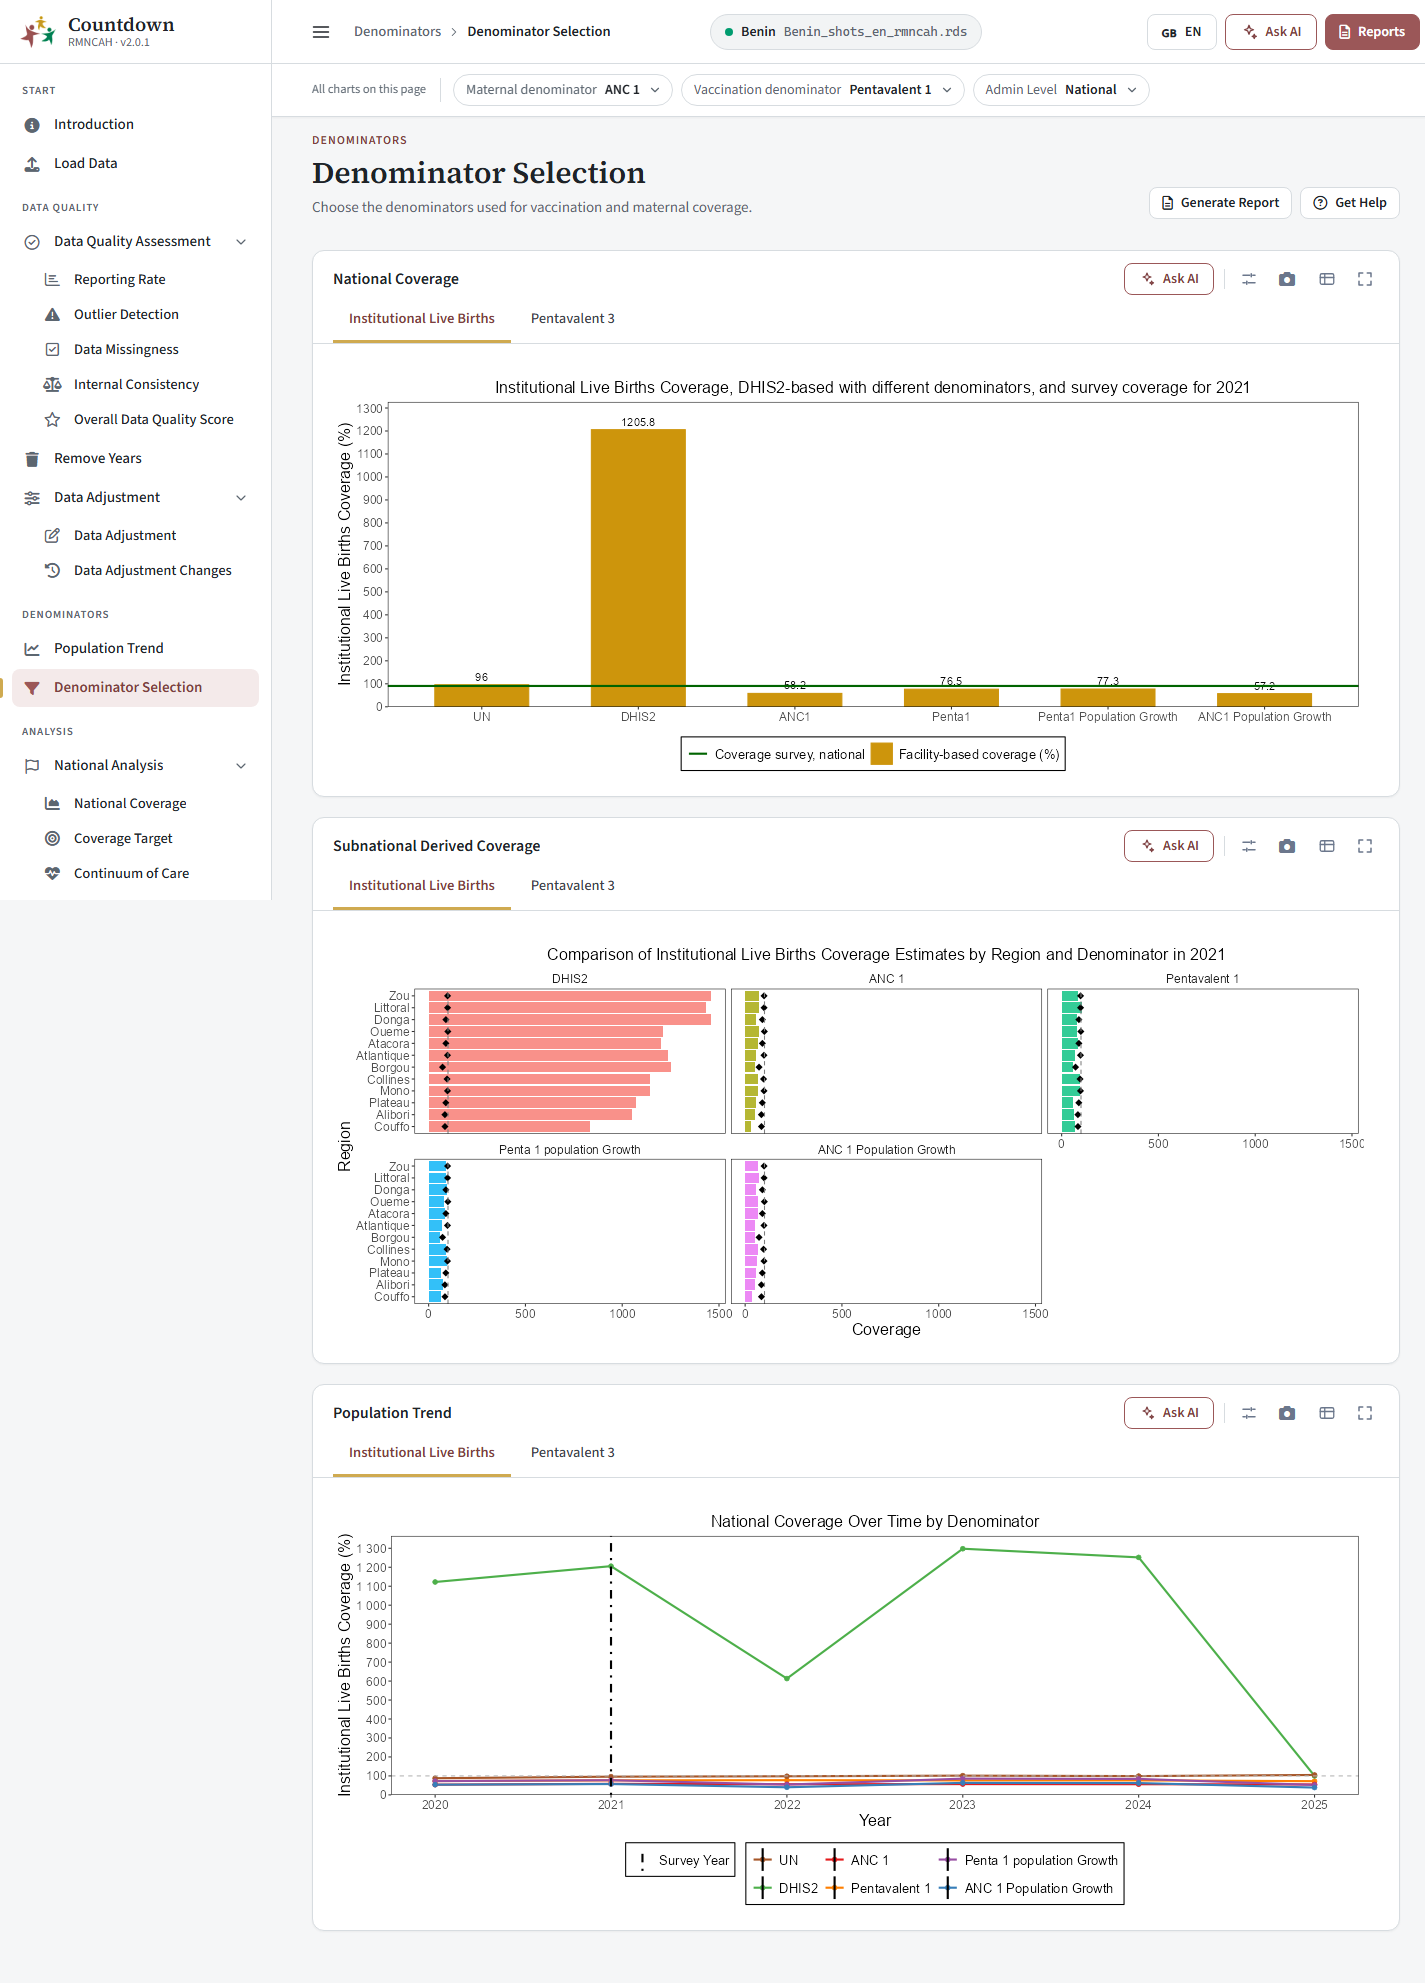 National coverage by denominator option compared with the survey estimate
b. Subnational level comparison on the survey year: In the second set of figures, the horizontal bars represent the coverage estimate from the routine data compared to the “diamond” which represents the survey estimate. A figure is produced for each denominator option. Review each figure and identify the best denominator option based on the closeness of the coverage estimate from the survey to that of the routine data. Look for the option that agrees best with the survey across regions. Similarly, examine estimates that are implausible (e.g., coverage estimates above 100%, or far above it). Note down the best denominator option.
c. Trends in national estimates: Examine the trend estimate for each denominator option by looking for consistency and overall plausibility in the historical trends: plausible, smooth trends.
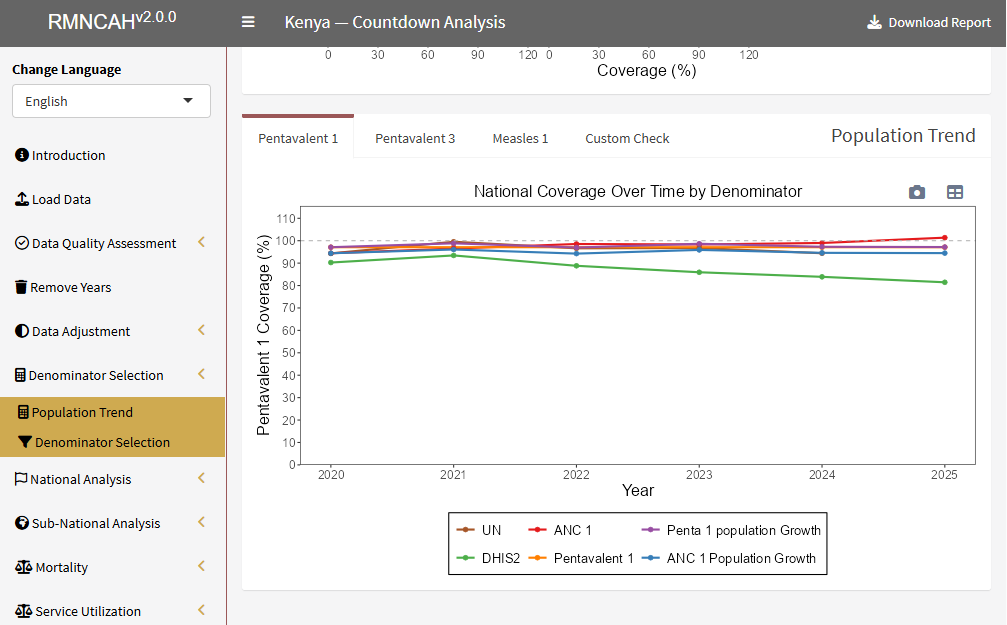 National coverage over time by denominator option
The survey is the gold standard. The guidebook compares the coverage of institutional live births and Penta-3 from each option with the most recent survey, and selects the method with the smallest absolute difference between the routine and survey coverage, at national and subnational level.
Final selection and synthesis
Combine your notes from sub-steps (a), (b), and (c) above to select the best-performing denominator (one or two, depending on the analysis: see Selecting the best denominator option).
Summarize your choice in a short paragraph, documenting the justification for each denominator you selected.
- The best denominator is not the one that gives the highest coverage, but the one that best agrees with (is closest to) the survey and stays stable and consistent over time.
- Denominators derived from ANC 1 or Penta 1 assume that most of the population attends the service and that facilities report completely. They are weakest where reporting is poor; if results look odd, go back to Data quality.
- Sub-national denominators can be less reliable than national ones. Read them together with district data quality.
A denominator derived from Penta1 makes Penta1 coverage look near 100 percent by construction. Judge it on Penta3 and Measles 1, and against the survey.
Common pitfalls
- Comparing against the survey when the survey year is far from the analysis years. Weigh that in your judgement.
- Choosing a denominator per chart instead of once for the whole analysis. The denominator you select changes every coverage, inequality, target, mortality and health system result.
In the apps
Assess the population trends
On Denominator Assessment (Population Trend in the Vaxx app), compare the UN and DHIS2 projections and select the best population (see Denominator Assessment).
Compare the denominator options
On Denominator Selection, compare coverage under each option with the survey, nationally, subnationally and over time (see Denominator Selection).
Choose the denominator
Set the denominator(s) the rest of the analysis uses (see Choose the denominator).
See also
- Coverage analysis: rationale
- Formulas: denominators
- Defaults and thresholds: denominators
- Glossary: Service coverage, Immunization denominator (BCG, Penta), Measles denominators
- Previous step: Data adjustment · Next step: Coverage