Introduction
Missing reports and data errors distort coverage analysis, particularly when reporting rates are low or sporadic. Using a scientifically grounded adjustment factor—based on assumptions about relative service volumes in reporting versus non-reporting facilities—the Data Suite scales up numbers proportionally to reflect the true population-level coverage.
The adjustment strategy is pragmatic: if we assume all non-reporting facilities provided zero services, we dramatically underestimate true coverage. Instead, the module estimates what proportion of services likely occurred in silent facilities (typically 25% of reporting facility volumes, by default) and adjusts accordingly. For data periods with critically low reporting (below 75%), no adjustment is applied and those years are flagged as unreliable—protecting your analysis from impossible estimates based on insufficient data.
Rationale: Scientific basis for the analysis
The completeness of institutional reporting can heavily distort coverage analysis, particularly if reporting levels are low or fluctuate significantly between years.
Similarly, extreme outliers—such as an accidental extra zero keyed during data entry—can exert a disproportionate impact, especially on sub-national metrics. Following our baseline data quality assessments, corrective steps are necessary to generate a clean, standardized dataset for final analysis. This requires mathematically adjusting for incomplete reporting and resolving extreme outliers.
Approach: Description of analytical steps
If we fail to adjust for reporting completeness, we implicitly assume that all non-reporting facilities provided zero health services during their silent periods, which is statistically improbable.
Adjustments depend on estimating the true volume of services (e.g., antenatal care, vaccinations) provided at non-reporting facilities relative to those that submitted data. To do this, we establish an adjustment factor, denoted as .
The adjustment factor is defined as the ratio of the volume of services provided by non-reporting facilities to the volume of services provided by reporting facilities. This factor is used directly to scale up reported numbers to offset incomplete reporting gaps.
6.2 Numerator Adjustment Formulas and Parameters
To accurately account for incomplete reporting, the raw reported number of events is adjusted using both the reporting completeness proportion and the facility service volume ratio via the following equation:
Where:
N_{\text{adj}}: Total estimated number of health events adjusted for incomplete reporting.
- : Raw number of events reported in the system.
- : Reporting completeness (expressed as the proportion of expected facility reports actually received).
- : The adjustment factor accounting for lower relative service volumes in non-reporting facilities.
Configuring the -Factor
By default, the platform sets a baseline value of ** **. This assumes that non-reporting facilities are active but operate at a lower capacity, providing a service volume equivalent to exactly one-quarter (25%) of an average reporting facility.
However, the factor can be adjusted manually for different services based on system context. For example, if private health facilities have poor reporting compliance but handle a large share of maternal deliveries nationally, may be raised above 0.25, or set as high as 1.0.
Depending on local infrastructure, you can select from the following k-value tiers:
k = 0.00– No services provided in non-reporting facilities.k = 0.25– Some services provided, but at a volume much lower than reporting facilities (Default).k = 0.50– Services provided at half the rate compared to reporting facilities.k = 0.75– Services provided at nearly the same rate as reporting facilities.k = 1.00– Services provided at the exact same rate as reporting facilities.
Critical Data Threshold Rules
- The 75% Completeness Rule: If a district’s facility reporting rate drops below 75%, it becomes mathematically unreliable to impute missing data. Therefore, no adjustments are applied if reporting is lower than 75%. In these scenarios, further coverage calculations using the facility data are flagged as insufficiently reliable for endline evaluation.
- Outlier Correction: Extreme outliers are corrected by stripping the erroneous value and imputing the median monthly value calculated for that specific facility/district within the same calendar year.
Table 2: Summary of Data Adjustment Business Rules
| Observed Problem | Identification & Threshold Criteria | Imputed Corrective Action |
|---|---|---|
| Critically Low Reporting Rates | Any district reporting rate falling below 75% (Default threshold). | Data are imputed using the median monthly value for that district-year for the specific silent month. |
| Incomplete Reporting Gaps | Reporting rates sit between 75% and 100%. | The Adjustment Factor (Default 0.25) is applied to scale up the raw numbers and compensate for the non-reporting facilities. |
| Extreme Outliers | A monthly value is greater than or smaller than 5 times the Median Absolute Deviation () from the district monthly median. | The extreme value is discarded and replaced with the district median value for that same calendar year. |
| Missing Values | Null or empty data fields discovered within an active reporting period. | The missing field is imputed with the district median monthly value for that specific year. |
6.3 Implementation: Conducting Analysis in the Data Suite
The outputs and configurations for this phase are managed directly through the Data Adjustment section of the Data Suite.
Within this module’s user interface, select the specific -factor value that is deemed appropriate given your unique country context and facility ecosystem in order to execute the data cleaning pipeline.

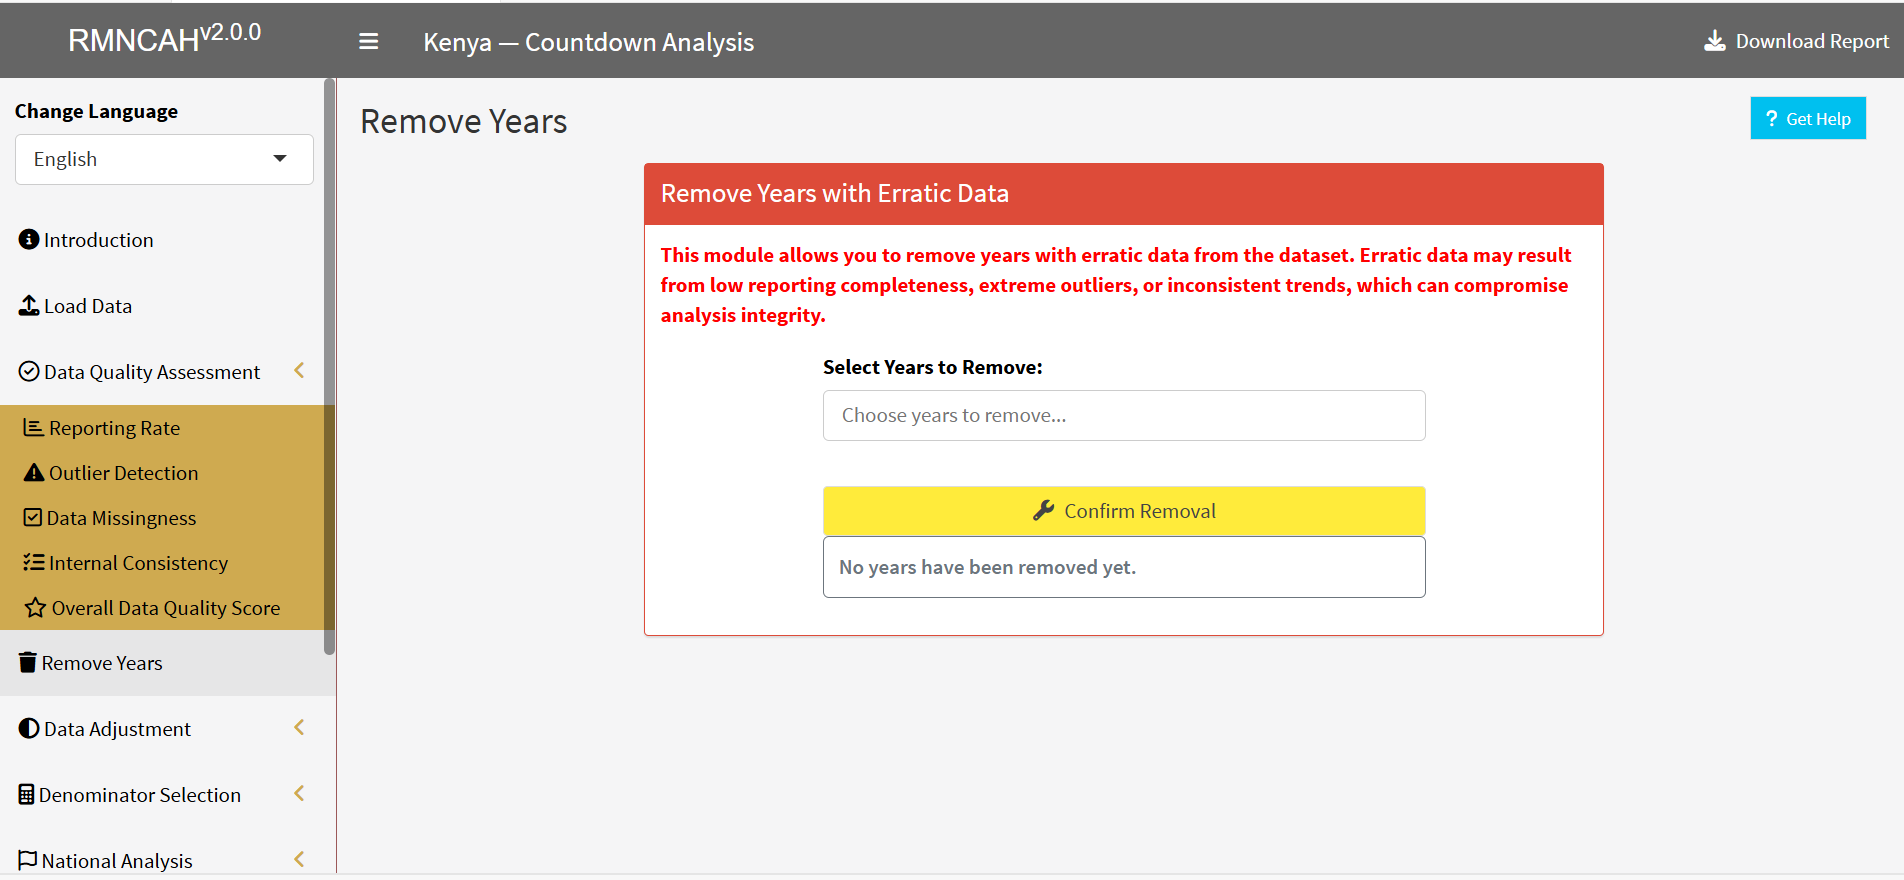
6.3.1 Remove Years
The Remove Years configuration panel allows you to completely exclude specific calendar years from the active processing pipeline. This tool is designed to drop years that contain zero reporting data, or whose data has been explicitly flagged as unfit for analysis by the national technical team due to severe, systemic quality issues.
It is highly recommended to use this feature when:
- The quantitative data quality baseline falls well below acceptable standard thresholds.
- The country team possesses sufficient, verified contextual information (e.g., major system-wide roll-out failures, prolonged network blackouts, or database corruption events) that render that specific year’s data completely unreliable or inaccurate.
Strategically removing these corrupted historical blocks ensures that your subsequent coverage timelines and trend assessments are built exclusively upon a robust, reliable data foundation.
6.3.2 Adjustment Outputs
This section produces a master adjusted dataset (.dta) ready for analysis, along with plots for different indicators showing the effect of data adjustments. The image below shows the adjustment output after making no adjustment to the data.

6.3.3 Report
The interpretation should include the selected adjustment factor (factor k) that was used to adjust for incomplete reporting (if necessary, by service). If the default factor is used, then report this and explain what this means for the reader.
Report the percentage change the adjustment produced in reported numbers of institutional deliveries and penta1 over the six-year period.
You may wish to:
- Highlight the year with the greatest impact of the adjustment if there is one.
- Interpret if the impact of the adjustment on coverage rates is large or small.
- Make the same description and interpretations for penta1 vaccinations.