Denominator Assessment and Selection
Objective
Service coverage is defined as the population who received the service divided by the population who need the services (also referred to as the target population).
The numerators of coverage statistics (e.g., number of live births in health facilities) are derived from the health facility data and need to be adjusted as shown in the previous section. The denominator of the coverage statistics (e.g., number of live births in the population) needs to be estimated for national and sub-national levels (regions/provinces and districts).
This section on denominator selection helps you select the most appropriate approach for denominator estimation for the computation of the coverage indicators at the national and sub-national levels. For more information, please refer to the guidebook on the Countdown DataSuite.
Denominator Options
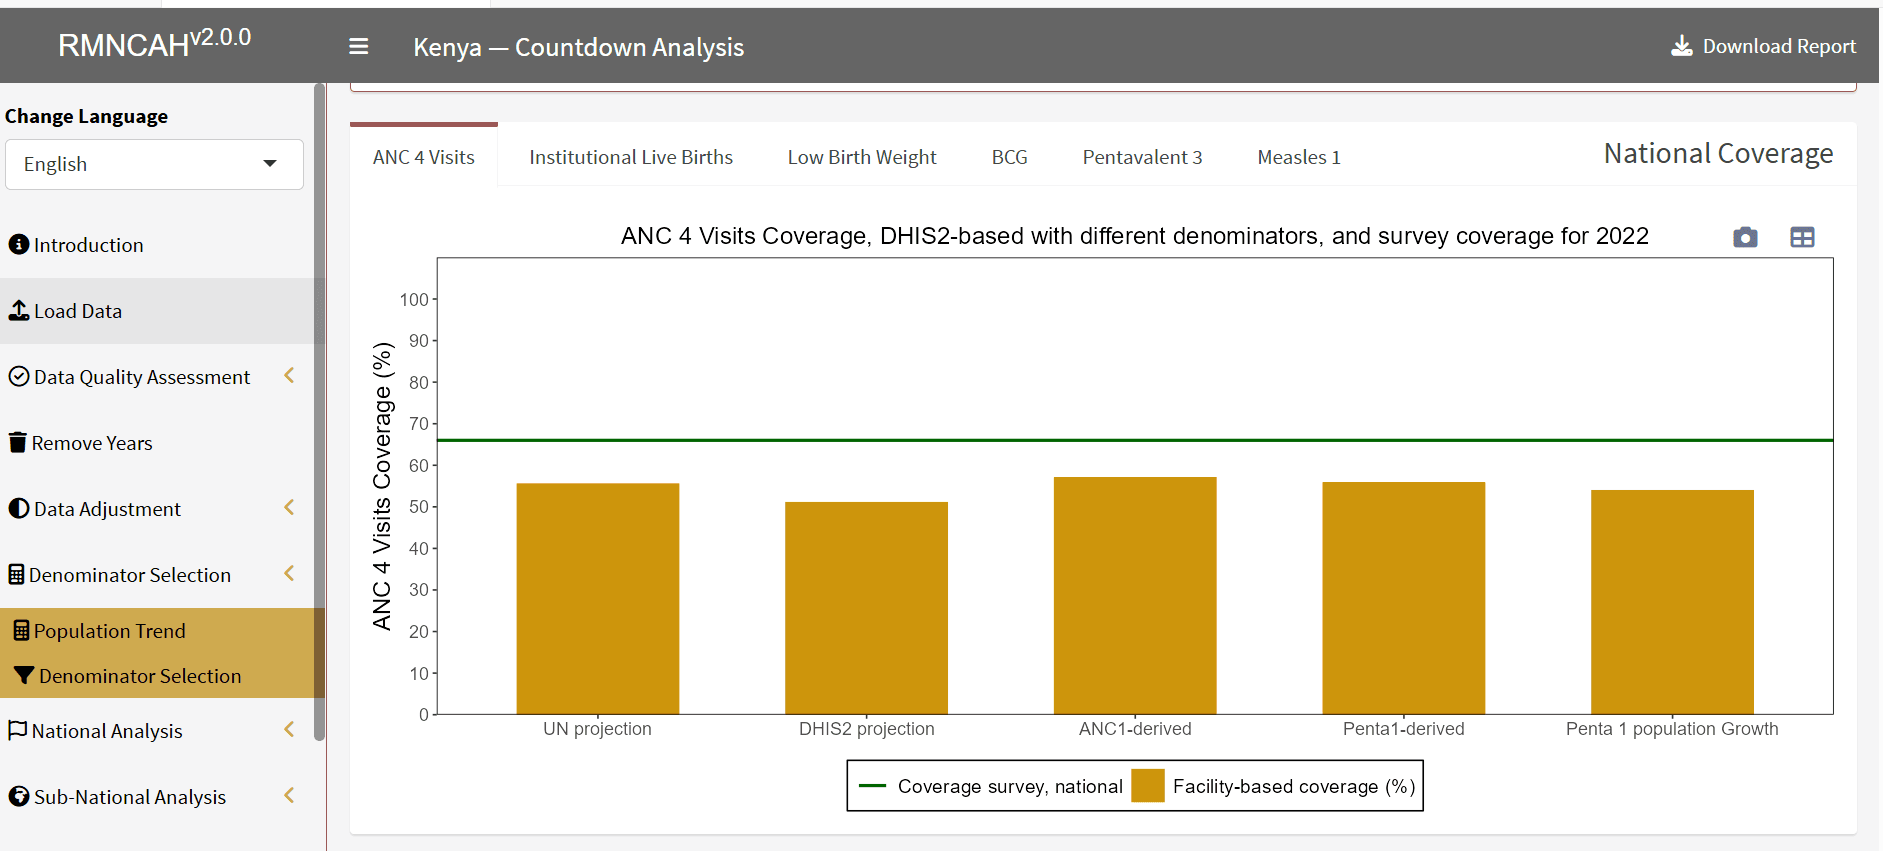
There are six denominator options that are analyzed to determine the most accurate baseline:
- The UN estimates of live births (UN projections)
- The DHIS-2 projection of live births (DHIS-2 projections)
- Derivation of denominators from ANC-1 services utilization (ANC-1 derived)
- Derivation of denominators from Penta-1 immunization (Penta-1 derived)
- Derivation of denominators from ANC-1 services utilization, with adjustment for annual population growth (ANC-1 population growth)
- Derivation of denominators from Penta-1 immunization, with adjustment for annual population growth (Penta-1 population growth)
Selecting the Best Denominator Option
The goal here is to identify the best denominator option for the computation of the coverage indicators. To identify the best baseline for each indicator, follow these steps:
Population Trend Comparison
Under the “Population Trend” section, compare the trends in the total population, total live births, and under-1 population between the UN and the DHIS-2 projections.
Select the indicator trends (total population, live births, or under-1 population) that are consistent across the two sources, with estimates generally close.
- Example: You may select the under-1 population if the UN estimates and the DHIS-2 projections for that demographic are very close.
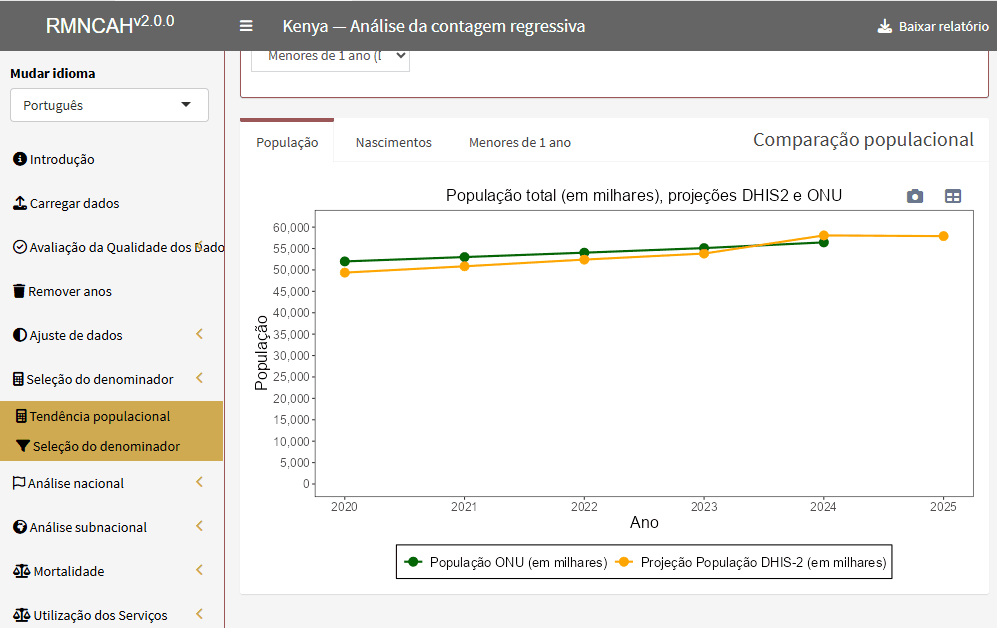
The indicator selected in this step will be used to adjust the ANC-1-derived and Penta-1-derived options with population growth.
Denominator Selection Examination
Under “Denominator Selection”, examine the consistency between the survey estimates and the computed estimate from DHIS-2 data using each denominator method. This is done by comparing three sets of graphs at national and sub-national levels:
a. Comparison of national estimates: First, compare the national estimate of each indicator between the routine data and the survey data by examining the first bar graph for the survey year. The figure shows a horizontal dotted line indicating the survey estimate and a bar corresponding to the routine estimate. In making this comparison, note down the best denominator options (there may be more than one viable option).
b. Sub-national level comparison on the survey year: In the second set of figures, the horizontal bars represent the coverage estimate from the routine data compared to the “diamond” which represents the survey estimate. A figure is produced for each denominator option. Review each figure and identify the best denominator option based on the closeness of the coverage estimate from the survey to that of the routine data. Similarly, examine estimates that are implausible (e.g., coverage estimates above 100%). Note down the best denominator option.
c. Trends in national estimates: Examine the trend estimate for each denominator option by looking for consistency and overall plausibility in the historical trends.
Final Selection and Synthesis
Combine your notes from sub-steps (a), (b), and (c) above to select the single best-performing denominator for each coverage indicator.
Summarize your choice in a short paragraph, documenting the justification for your selected denominator option for each coverage indicator.